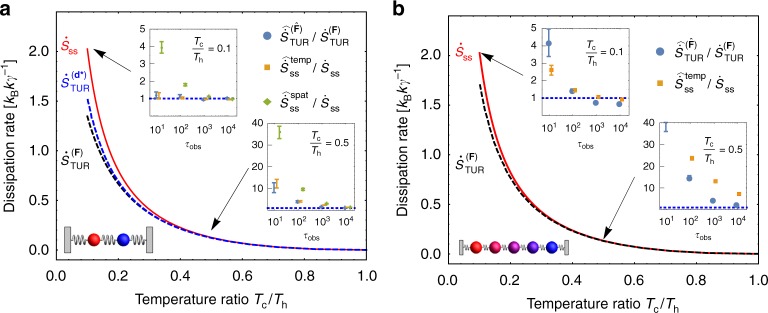
Fig. 4.
Performance of dissipation rate estimators. Data are shown both for the model with two beads (a) and the higher-dimensional model with five beads (b). The TUR bound with d = F (dashed black line) becomes tighter to the actual dissipation rate (solid red line) when the dynamics is closer to equilibrium (Tc/Th → 1) and in the limit of many beads. Inset plots show the estimator convergence rates for temperature ratios of 0.1 and 0.5, with error bars reporting standard error, computed from 10 independent samples. The blue dashed line in a is the TUR bound resulting from a Monte Carlo optimization scheme, as described further in Fig. 5. The bottom right inset of b reflects that the TUR estimator may be useful as a practical proxy for the entropy production rate for high-dimensional systems when the dynamics is weakly driven

