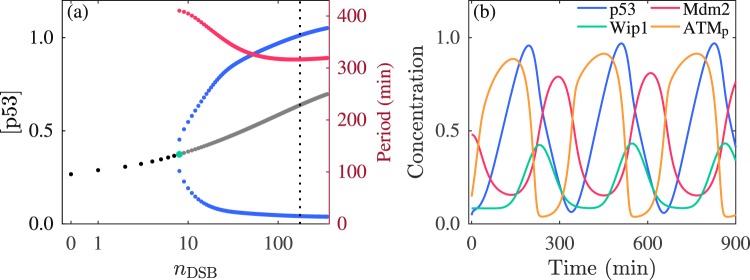
Figure 2.
Network dynamics without noise. (a) Bifurcation diagram of [p53] versus nDSB. Black and gray dots denote the stable and unstable steady states, respectively. The blue dots denote the maxima and minima of p53 oscillation. The vertical dotted line indicates nDSB = 175. The red dots denote the oscillation period (right y-axis). (b) Time courses of protein concentrations at nDSB = 175. [p53] and [Mdm2] denote the total concentration of unphosphorylated and phosphorylated p53 and that of nuclear and cytoplasmic Mdm2, respectively.

