Figure 3.
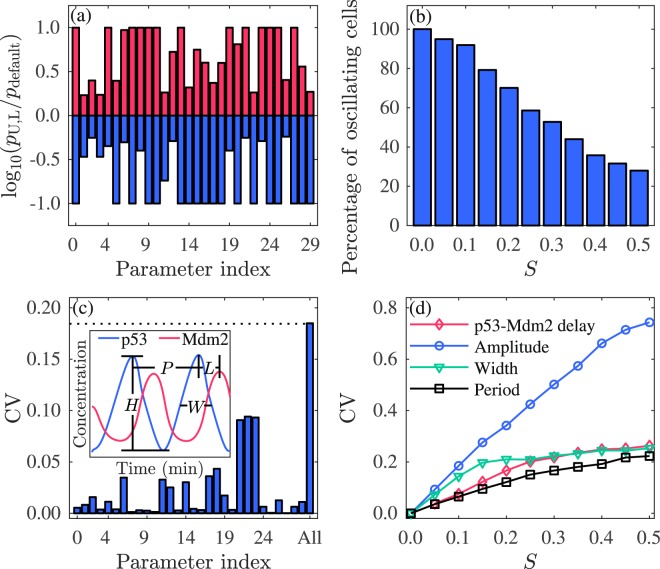
Influence of cellular heterogeneity on p53 oscillation. (a) Base-10 logarithm of the ratio of the upper (red) or lower (blue) threshold of each parameter admitting p53 oscillation to its default value. The parameter value ranges from 0.1 to 10 times its default value. Parameters are indexed as follows: 0. nDSB, 1. kdwip1, 2. krwip1, 3. kdwip1m, 4. kswip1, 5. kswip10, 6. kdmdm2n1, 7. kdmdm2n0, 8. ki, 9. ko, 10. kdmdm2c, 11. krmdm2, 12. kdmdm2m, 13. ksmdm2, 14. ksmdm20, 15. kdp53s, 16. kbdp53p, 17. kdp53, 18. kbdp53, 19. kacp531, 20. kwip53s, 21. krp53, 22. kdp53m, 23. ksp53, 24. kudim, 25. kdim, 26. kdeatmwip, 27. kdeatm, 28. kauto, and 29. kacatm. (b) Percentage of oscillating cells versus S. (c) CV for the amplitude of p53 oscillation when each parameter alone (0–29) or all parameters (All) are perturbed at S = 0.1. The dotted line denotes the estimate of the CV in the latter case. The inset schematically shows the amplitude (H), width at half height (W), period (P) of p53 pulses and the p53-Mdm2 delay (L). (d) CVs for the amplitude, width, period of p53 oscillation and p53-Mdm2 delay versus S. All parameters are perturbed.

