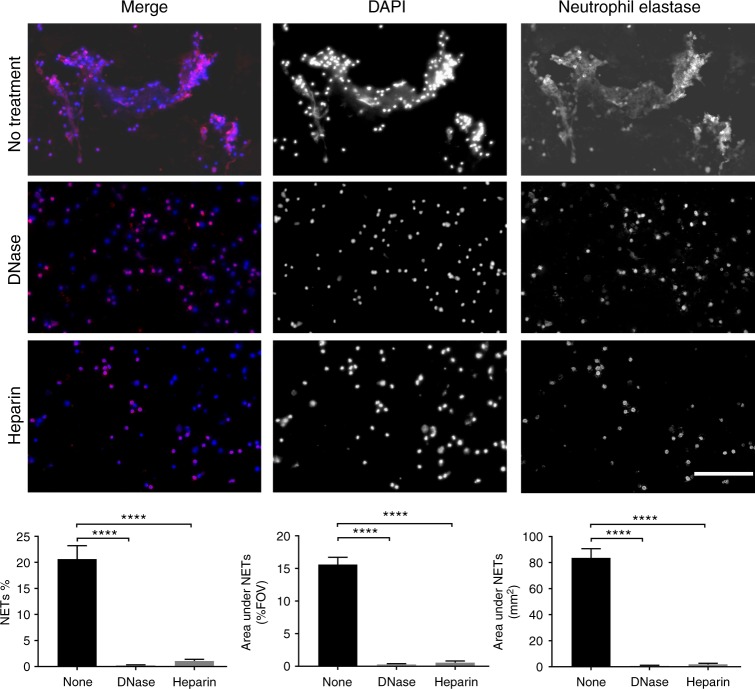
Fig. 2.
DNase and heparin degrade NETs ex vivo. Cerebrospinal fluid samples from some of the ABM patients (n = 3) were treated with DNase or heparin prior to visualization by immunofluorescence against neutrophil elastase (red) and DNA (blue). Areas of red and blue colocalization represent NETs. NETs were quantified using Fiji and expressed as percentage of NETs, percentage of staining under NETs per field of view and total area under NET staining in square millimeters. All groups were compared to ABM by one-way ANOVA followed by Sidak’s multiple comparisons test, coulmns represent mean values, ****P ≤ 0.0001 and error bars denote standard deviations (n=3). Scale bars denote 200 µm

