Fig. 2.
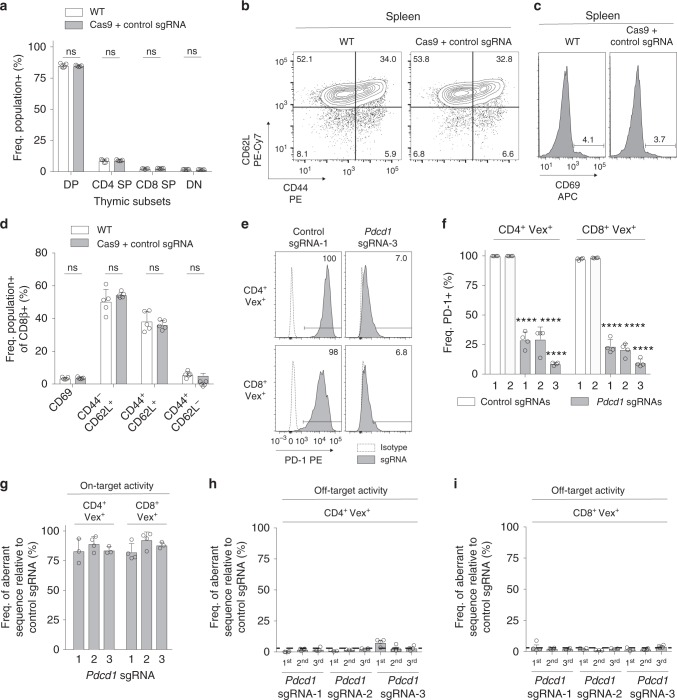
Deletion of genes in naive T cells with minimal off-target editing using CHIME. a Quantification of thymic subsets (CD4– CD8–, CD4– CD8+, CD4+ CD8–, CD4+ CD8+) from WT or Cas9 + control sgRNA chimeric mice. b Representative flow cytometry plots of CD44, CD62L, and c CD69 from splenic CD8+ T cells. d Quantification of naïve status of CD8+ T cells in (b, c). e Flow cytometry plots of PD-1 expression in CD4+ T cells (top panel) and CD8+ T cells (bottom panel) from representative non-targeting control sgRNA or Pdcd1 sgRNA chimeras following αCD3/CD28 stimulation. f Quantification of PD-1 expression for two control and three Pdcd1 sgRNAs from (e). g TIDE assay on naïve CD4+ and CD8+ T cells for three Pdcd1 targeting sgRNAs. h, i TIDE assay on naïve (h) CD4+ and (i) CD8+ T cells designed to detect the top three predicted off-target sites (1st, 2nd, 3rd) for three Pdcd1 targeting sgRNAs. Dashed line represents the aberrant sequence (%) when comparing two non-targeting control sgRNAs (background aberrant sequence). All experiments had at least three biological replicate animals per group and are representative of two independent experiments. Bar graphs represent mean and error bars represent standard deviation. Statistical significance was assessed among the replicate bone marrow chimeras by one-way ANOVA (a, d, f) (*p < .05, **p < .01, ***p < .001, ****p < .0001). See also Supplementary Fig. 2. Source data are provided as a source data file

