Fig. 3.
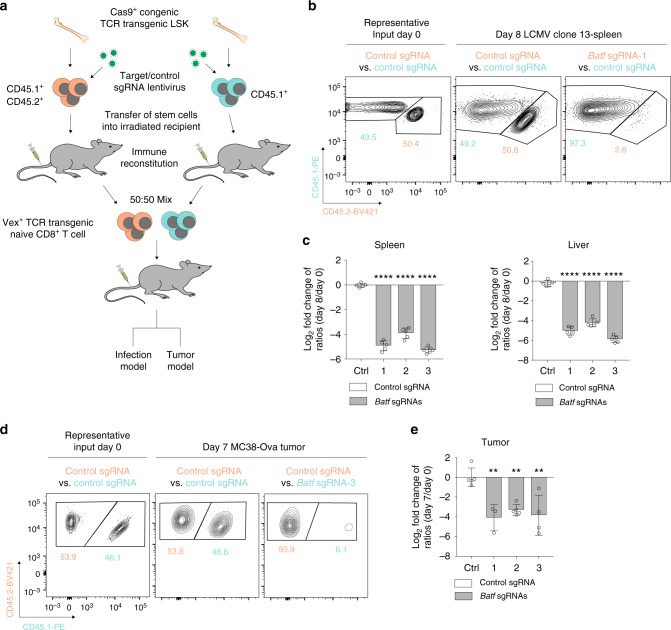
CHIME recovers known positive regulators of effector CD8+ T cell responses. a Schematic of competitive assays. b Representative input and output flow cytometry plots of P14 T cells containing control sgRNA vs. control or Batf sgRNAs in the spleen 8 days post LCMV Clone 13 viral infection. c Quantification of P14 T cells containing control or Batf sgRNAs from the spleen (left) and liver (right) in (b), normalizing the output flow cytometry plots to the input ratios at day 0 and log2 transforming the data. d Representative output flow cytometry plots of OT-1 T cells containing control sgRNA vs. control or Batf sgRNAs in MC38-OVA tumors on day 7 post injection. e Quantification of OT-1 T cells containing control or Batf sgRNAs in (d) with normalization of the output flow cytometry plots to the input ratios at day 0 and log2 transformation of the data. All experiments had three biological replicate animals per group and are representative of two independent experiments. Bar graphs represent mean and error bars represent standard deviation. Statistical significance was assessed among the replicate recipients of transferred T cells by one-way ANOVA (c, e) (*p < .05, **p < .01, ***p < .001, ****p < .0001). See also Supplementary Fig. 2. Source data are provided as a source data file

