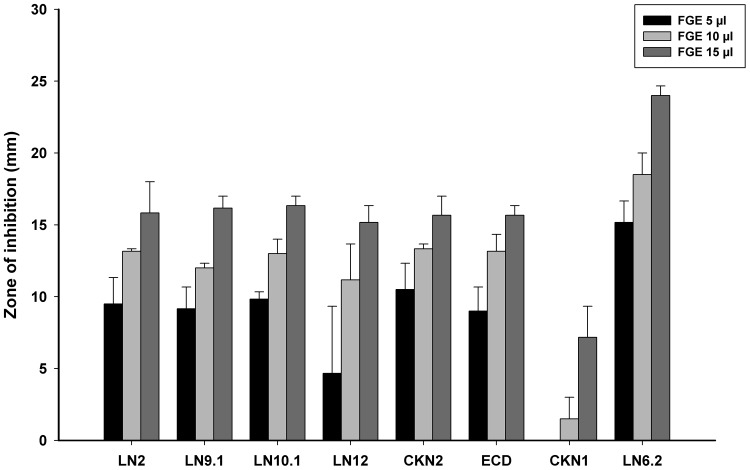
Fig. 1.
Antibacterial activity of garlic against STEC isolates. The graph represents average zone of inhibition (mm) with increasing volume of FGE against STEC isolates as labelled in the figure. The graph shows that there is dose dependent increase in the antibacterial activity of FGE against STEC isolates. The graph represents the data of three sets of triplicate data

