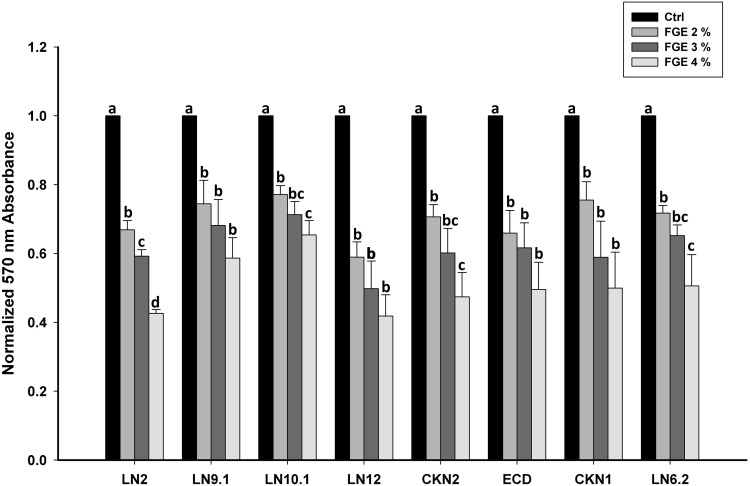
Fig. 2.
Anti-biofilm activity of garlic against STEC isolates. The graph shows the average 590 nm reading of crystal violet staining of biofilm which is normalized to untreated control sample. The effect of increasing percentage of FGE against STEC isolates shows decrease in biofilm formation as labelled. Different letters indicate mean values (n = 3) that are significantly different at p < 0.05, according to DMRT for each different parameter

