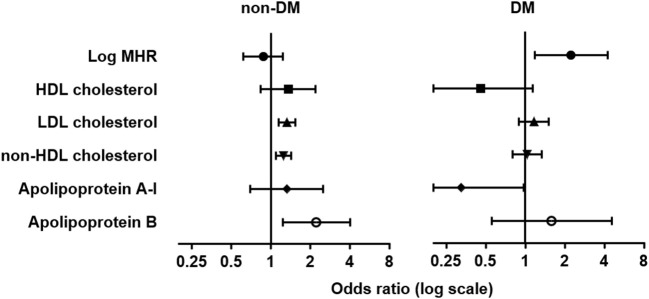
Figure 4.
Forest plots of odds ratio (OR) and 95% confidence interval (CI) for elevated carotid intima-media thickness. Forest plots were grouped by MHR and traditional lipid variables in the adjusted logistic regression model (model 3) in non-diabetic (non-DM, left) and patients with type 2 diabetes (DM, right). Elevated CIMT was defined as CIMT in the fourth quartile (≥0.73 mm).

