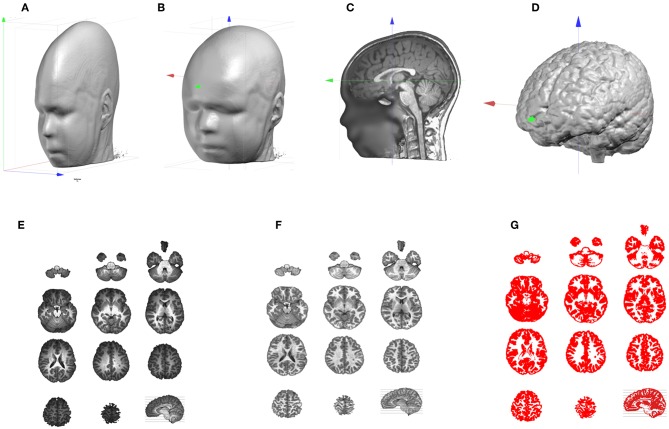
Figure 2.
Illustration of the MRI processing pipeline. (A) Original anisotropic MRI. (B) Result of up-sampling and re-orientation, with red, green, and blue axis pointing, respectively to X, Y, Z. (C) Adjustment of the cutting planes and setting of the AC origin. (D) Result of the skull-stripping to isolate the brain. (E) Brain slices which exhibit the Bias Field of the original MRI. (F) Same brain slices post-Bias Field Correction. (G) Extraction of the Gray matter.

