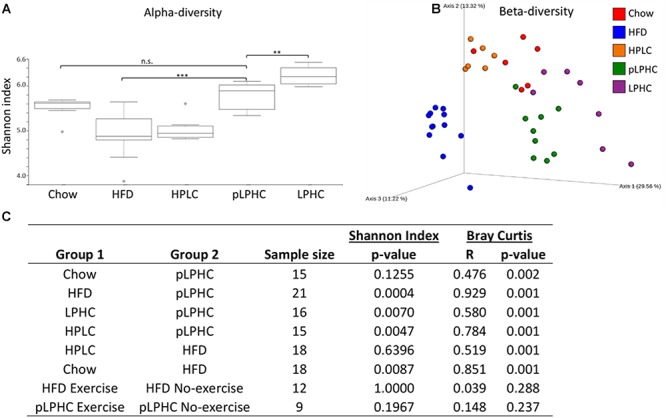
Figure 1.

(A) Alpha-diversity measured as Shannon index. Gray dots are outliers. (B) PCoA plot of the beta-diversity based on the Bray-Curtis metric. (C) Statistical pairwise group comparisons. HFD, High fat diet; HPLC, High protein low carbohydrate; pLPHC, periodized low protein high carbohydrate. ∗p < 0.05, ∗∗p < 0.0071, ∗∗∗p < 0.0005.
