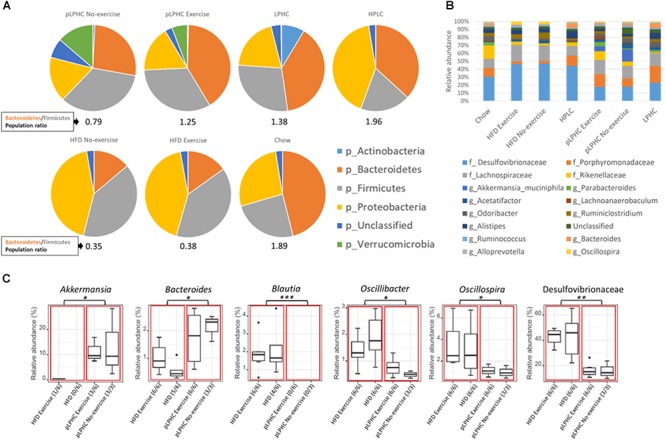
Figure 2.

(A) Pie charts showing the relative taxonomic abundance of bacterial phyla as determined by 16S rRNA gene amplicon sequencing. (B) Bar chart of the 16 most abundant bacterial families and genera. (C) Group significance analysis of selected bacteria suggested in the literature to have a positive or negative impact on metabolic diseases. The red boxes divide the chart into a HFD and pLPHC and the black dots are outliers. HFD, high fat diet; HPLC, high protein low carbohydrate; pLPHC, periodized low protein high carbohydrate. ∗p < 0.05, ∗∗p < 0.005, ∗∗∗p < 0.0005.
