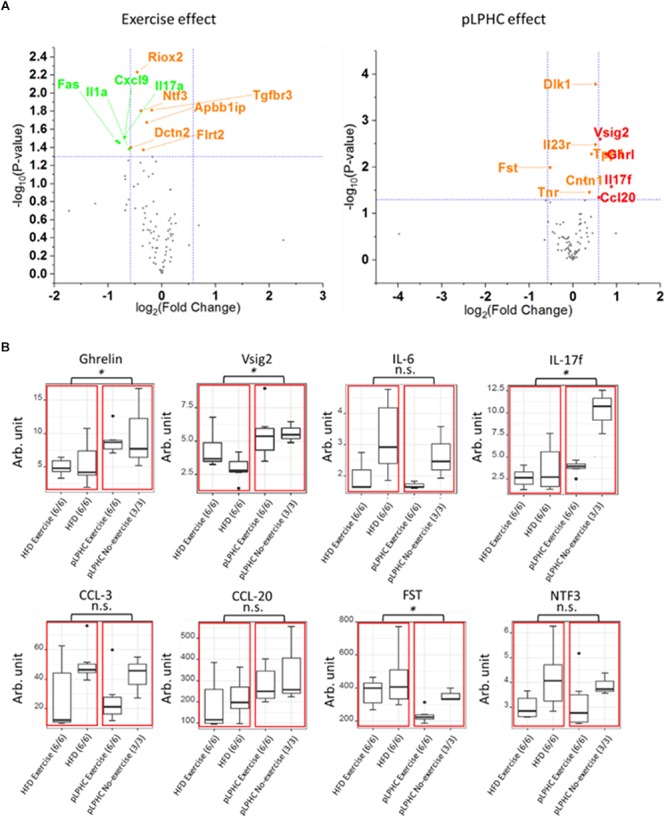
Figure 3.

(A) Volcano plot illustrating the effect of exercise or pLPHC (X-axis, log2 scale, cut-off >1.5 fold) vs. statistical significance (Y-axis, log10 scale, cut-off p < 0.05) on the expression of metabolic and inflammation related proteins in plasma measured using the Olink Exploratory mouse panel. Stippled lines denote cut-off values. Red – increase by pLPHC diet vs. HFD; Green – decreased by exercise vs. non-exercise. (B) Box and whiskers plots showing protein expression of eight significantly different plasma proteins (Ghrelin, Vsig2, IL-6, IL-17f, CCL-3, CCL-20, FST, and NTF3). The red boxes marks statistical analysis of the HFD and pLPHC group, and the black dots are outliers. HFD, high fat diet; HPLC, high protein low carbohydrate; pLPHC, periodized low protein high carbohydrate. ∗p < 0.05, n.s. – not significant.
