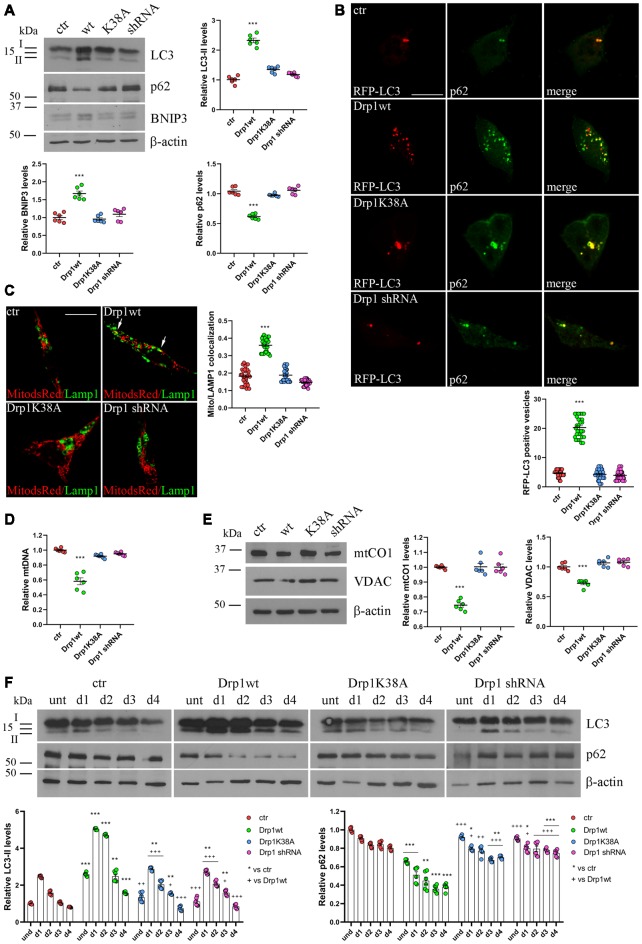
Figure 4.
Mitochondrial biogenesis and autophagy in Drp1-modified clones. (A) Autophagy is altered in clones overexpressing Drp1wt. Total extracts from Drp1wt, Drp1K38A, Drp1 shRNA and control cells were run onto 12% or 10% SDS-polyacrylamide gels and probed with anti MAP1LC3B, p62, BNIP3 and actin Abs. The two isoforms LC3-I and LC3-II are indicated. LC3-II, p62 and BNIP3 levels were quantified, normalized on actin levels and expressed as fold increase of control. The graphs show individual data plus the mean ± SEM (one-way ANOVA followed by Dunnett’s multiple comparison test, n = 6). Uncropped gels are in Supplementary Figure S8. (B) Drp1wt, Drp1K38A, Drp1 shRNA and control cells were transfected with MAP1LC3B-RFP for the staining of autophagosomes (red), fixed 24 h later and immunostained with anti p62 (green) Ab. Yellow in the merge images indicates colocalization of p62 and RFP-LC3. Total RFP-LC3 positive vesicles number is shown in the graph as individual data plus the mean ± SEM (one-way ANOVA followed by Dunnett’s multiple comparison test). Data were obtained from three independent experiments for a total of at least 30 cells for each sample. Scale bar: 10 μm. (C) Mitophagy is altered in clones overexpressing Drp1wt. Drp1wt, Drp1K38A, Drp1 shRNA and control clones were transfected with pDsRed2-Mito vector for the staining of mitochondria (red), fixed 24 h later and immunostained with anti Lamp1 (green). Yellow indicates co-localization. Pearson’s correlation coefficients for Mito dsRed and Lamp1 colocalization were determined in at least 30 cells/staining and reported in the graph as individual data plus the mean ± SEM (one-way ANOVA followed by Dunnett’s multiple comparison test). Scale bar: 10 μm. (D) Drp1wt overexpressing clones show reduced mitochondrial DNA (mtDNA). DNA was extracted from undifferentiated clones and used to quantify mtDNA by Real-Time PCR by using specific primers for NADH dehydrogenase 1 (ND1). RNAse P was used for normalization. Results are expressed as fold increase of control. Graph shows individual data plus the mean ± SEM (one-way ANOVA followed by Dunnett’s multiple comparison test, n = 6). (E) Drp1wt overexpressing clones show reduced mitochondrial content. Total extracts were prepared from undifferentiated clones, run on 10% SDS-polyacrylamide gels and probed with anti mtCO1 and VDAC Abs. mtCO1 and VDAC levels were quantified and normalized on actin levels. Results are expressed as fold increase of control individual data plus the mean ± SEM (one-way ANOVA followed by Dunnett’s multiple comparison test, n = 6). Uncropped gels are inSupplementary Figure S8. (F) Autophagy levels in neural stem cells aggregates. Drp1wt, Drp1K38A, Drp1 shRNA and control clones were induced to differentiate with RA and total protein extracts were prepared each day from d1 to d4, run onto 15% or 10% SDS-polyacrylamide gels and probed with anti MAP1LC3B, p62 and actin Abs. LC3-II and p62 levels were quantified, normalized on actin levels and expressed as fold increase of control. The graphs show individual data plus the mean ± SEM (two-way ANOVA followed by Tukey’s multiple comparison test, n = 6). Lines indicate samples to whom symbols are referred. Uncropped gels are in Supplementary Figure S8. * vs ctr (***p < 0.001; **p < 0.01; *p < 0.05); +vs Drp1wt (+++p < 0.001; ++p < 0.01; +p < 0.05).

