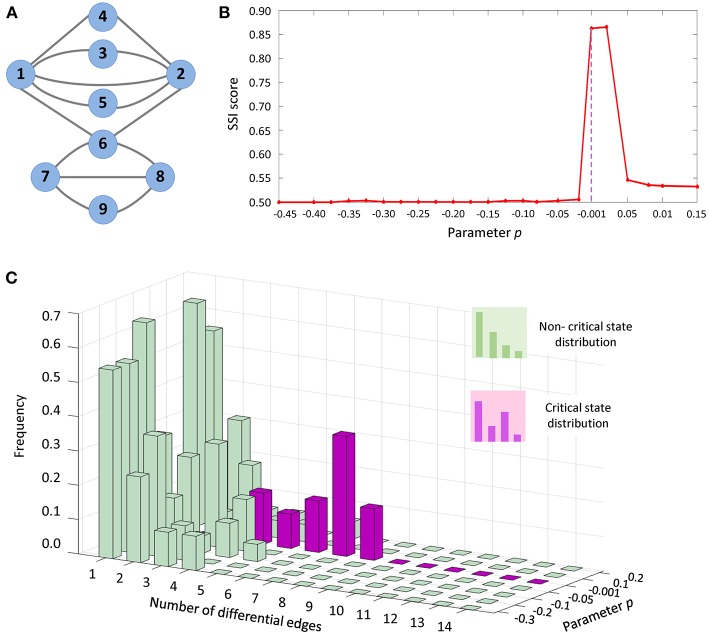
Figure 3.
The application of SSI score in numerical simulation. (A) The numerical simulation was based on a nine-node regulatory network. (B) The abrupt increase of SSI score indicates the tipping point at P = 0. (C) From the dynamical changes of differential-edge distribution, it is seen that there is a significantly different distribution (purple bars) comparing with others (green bars) when the system approaches the tipping point (p = 0).

