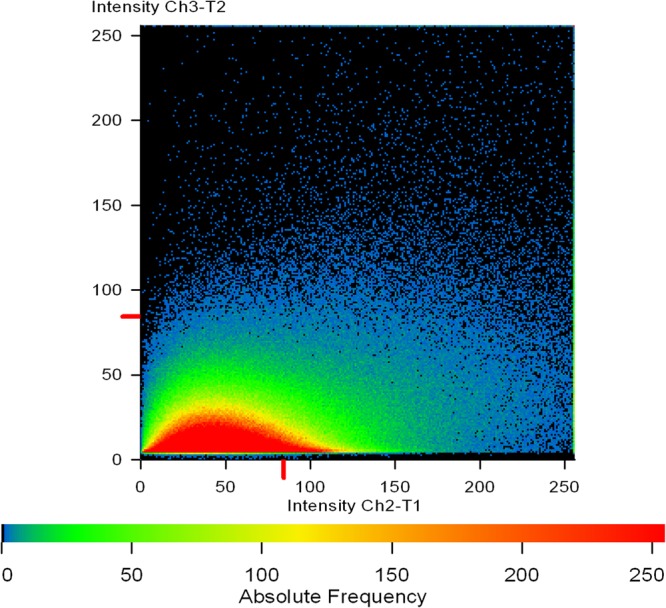
FIGURE 11.

A co-localization map of TRITC-labeled Concanavalin A (red) and phalloidin (green). Extracellular mannose/glucose is stained red by ConA-TRITC while extracellular green staining is of proteins/amyloids present in the matrix. The intermediary yellow signals represent the co-localization of ConA-TRITC and phalloidin green, indicating the entangling of sugars and proteins. One can note the linearity of the intensity on X-axis. The intensity of green signal is increasing with the increase in red signal.
