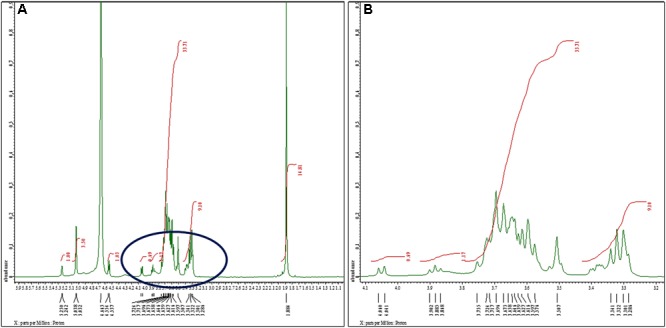
FIGURE 2.

1H nuclear magnetic resonance spectra of the sugar content. (A) 1H NMR (500 MHz, D2O): δ 5.25 (d, J = 4.0 Hz, 1H), 5.03 (d, J = 3.0 Hz, 3H), 4.55 (d, J = 8.5 Hz, 1H), 4.05 (d, J = 9.5 Hz, 1H), 3.88 (t, J = 8.5 Hz, 1H), 3.75–3.50 (m, 34H), 3.34–3.38 (m, 9H), 1.88 (s, 15H). We noted signals for N-acetyl-glucosamine (GlcNAc) and glucuronates at 1.884 and 3.341 ppm, respectively. Glucose exhibited singlet for α-anomer at chemical shift 5.038 ppm. We observed another singlet peak at 5.032 ppm because of H1 proton of α-anomer of galactose. The peaks at 4.944, 4.995, 5.017, 5.041, and 5.196 ppm were assigned to α- and β-D-glucose, α-D-mannose, and α-l-rhamnose sugars, respectively. (B) Extended spectrum of encircled region of (A). Most of the signals stretch out in a narrow region (non-anomeric) ranging between 3.286 and 3.724 ppm.
