FIGURE 8.

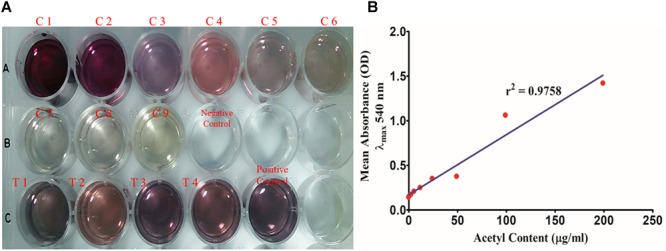
(A) Total acetyl content of the biofilm matrix. (C1–C9) Glucose pentaacetate as the standard in concentration range of 200–1.562 μg/well. (T1–T4) 250 μl of the test samples of the biofilm matrices of different isolates were utilized for the study. (B) Standard plot of glucose pentaacetate showing linear correlation between absorbance at λmax 540 nm and total acetyl content with correlation coefficient r2= 0.9758.
