
FIGURE 1.
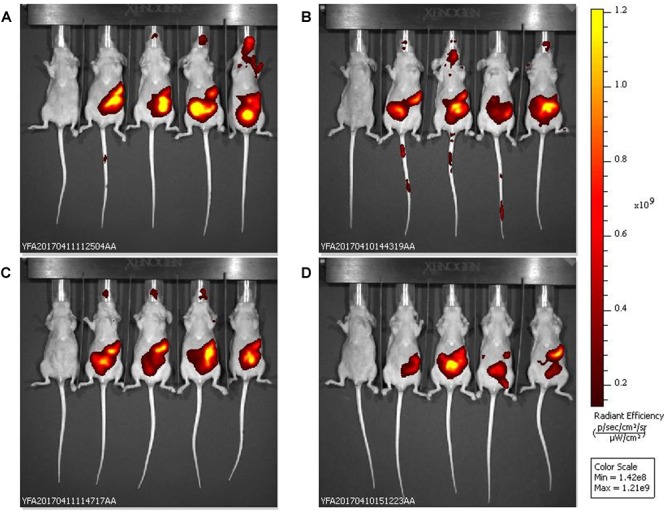
In vivo fluorescence images of the biodistribution in mice of VTS-750-stained UAB_Phi20: non-encapsulated phages (A,C) and the products of phage encapsulation (PPE) (B,D). The ventral side of each mouse was imaged 2.5 h (A,B) and 5.5 h (C,D) after oral administration of the phage preparations (n = 4 mice per group). The pseudocolor scale bars are consistent for each corresponding view and show the relative changes over time.