
FIGURE 2.
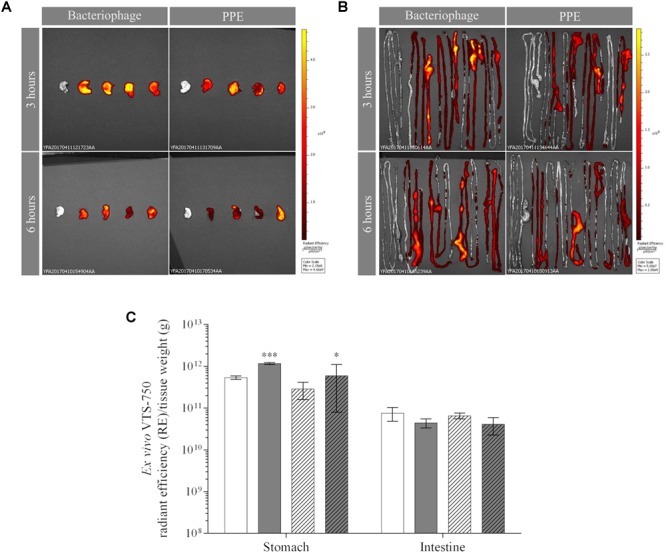
Ex vivo fluorescence of bacteriophages and PPE in the mouse stomach (A) and intestine (B) 3 and 6 h post-administration. The dorsal view of both organs is shown. Pseudocolor scale bars are located on the right for each corresponding set of images. (C) Fluorescence accumulation (RE) per tissue weight (g) in the stomach and intestine 3 h (solid) and 6 h (dotted) after the administration of non-encapsulated phages (white) or PPE (gray). Values of RE/g of PPE were obtained after taking into account the fluorescence attenuation (3.4-fold) observed in the in vitro experiment. The significance of the RE/g values of the encapsulated vs. non-encapsulated phage is shown: ∗∗∗P < 0.001 and ∗P < 0.05.