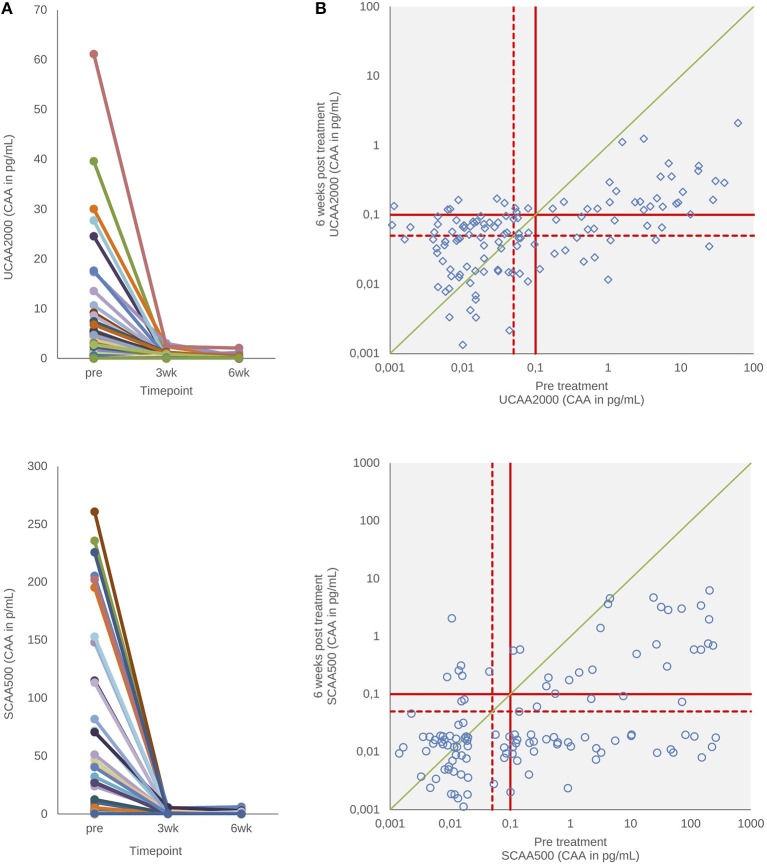
Figure 3.
CAA levels before and after drug treatment. (A) The decrease in urine and serum CAA concentrations showing the respective values before and 3–6 weeks after treatment with praziquantel. (B) Scatter plot of the urine and serum CAA concentrations as determined before and 6 weeks after treatment. The solid red lines indicate high-specificity cut-off levels, while the dotted red lines indicate lower specificity levels. Samples that have concentrations in the in-between region would be classified as “indecisive.” The solid green diagonal line in (B) indicates the “no change in CAA concentration” position; samples with values below this line indicate a decrease of the CAA concentration 6 weeks after treatment.

