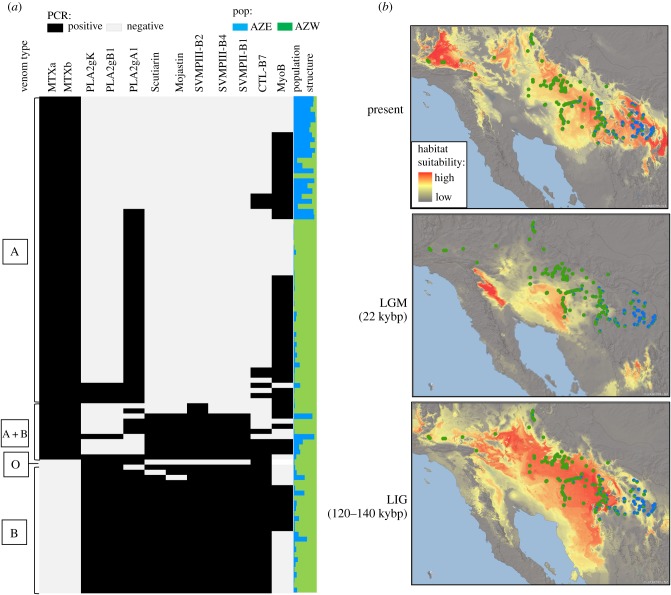
Figure 2.
Toxin genotype and niche modelling. (a) Presence–absence matrix of toxin genes and admixture plot (TESS) with K = 2. (b) Niche models and sample distribution of the Mojave-Sonoran clade of Crotalus scutulatus with individuals represented by proportion of genetic clusters. Grey lines delineate ecoregion boundaries.

