Figure 2.
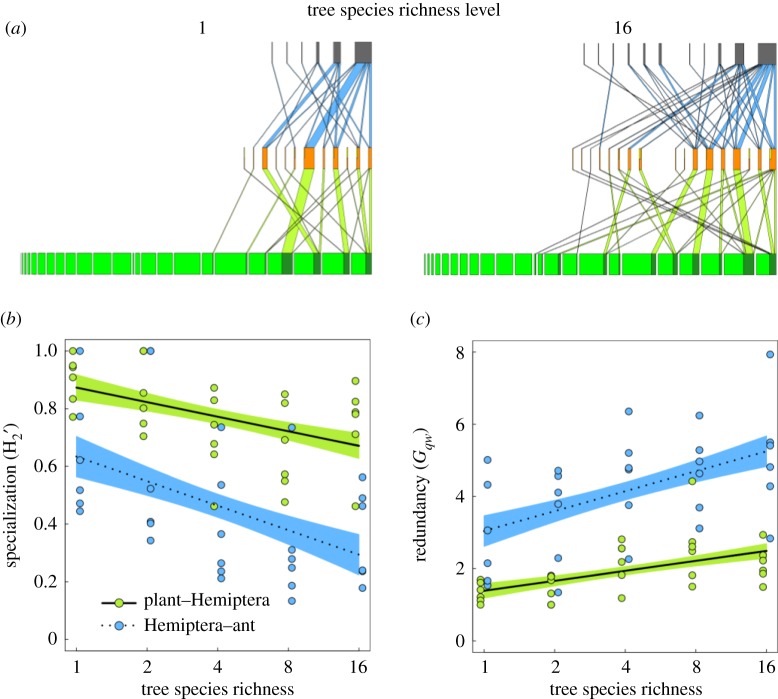
Multi-trophic networks in response to experimentally manipulated tree species richness. Example multi-trophic networks (a) of lowest (1) and highest (16) tree species richness. Ants (grey bars), the highest trophic level, interact with Hemiptera (orange bars) in trophobioses (mutualism, blue links). The intermediate trophic level Hemiptera (orange bars) interacts with trees, the lowest trophic level (green bars), as herbivores (antagonism, light green links). Each box represents one species and the box width the relative share of all interacting individuals, light green and yellow indicate the share of the non-interacting tree and Hemiptera individuals. Connecting links represent trophic links between two species and their width the relative share of all interactions of the two connected trophic levels. To illustrate interaction network changes the depicted networks are based on rarefied data (the abundance of each tree species is the same for each tree species richness level, here shown for levels 1 and 16) and the position of each species is identical in both networks. Network indices describing these networks in relation to tree species richness are shown in the lower panels (for rarefied data, see electronic supplementary material, figure S2, and table S7). (b) Network specialization of plant–Hemiptera (green dots, solid line ± standard error show model predictions) and Hemiptera–ant (blue dots, dashed line ± standard error show model predictions) interactions decreased with tree species richness, while (c) the corresponding network interaction partner redundancy (Gqw) increased. The antagonistic interaction is more specialized, as indicated by higher and lower Gqw, than the mutualistic interaction (see electronic supplementary material, table S6). In (b) and (c) tree species richness was log2-transformed. (Online version in colour.)

