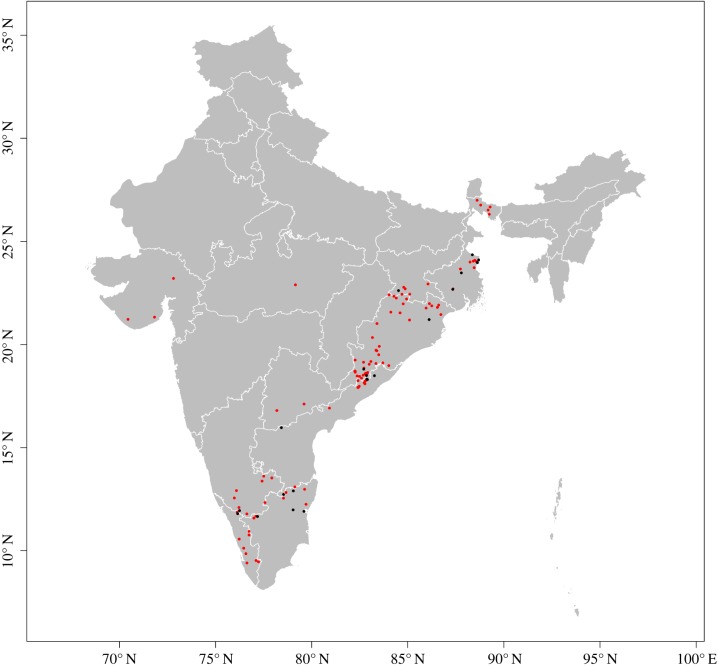
Figure 2.
Distribution of anthrax outbreaks documented by the Pro-MED mail surveillance mechanism between 2000 and 2018 (red) and an independent sample of laboratory-confirmed outbreaks (black) used for model testing and evaluation. All maps are displayed only for the purposes of depicting the distribution of disease occurrence and risk, and do not reflect the authors' assertion of territory or borders of any sovereign country including India. Map direction and scale are represented by the latitude and longitude grid along the box. All maps are created in R (v. 3.3.1). (Online version in colour.)

