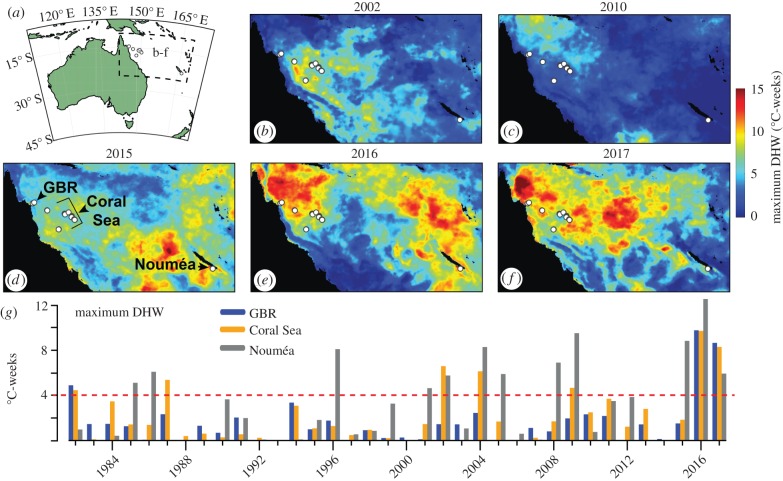
Figure 1.
Heat stress on coral reefs in the twenty-first century. (a) Map of the Australia region, with dashed box indicating the GBR, Coral Sea, and Nouméa area. (b–f) Maps of maximum DHW at 5 km resolution per annum (colours) for key years with the highest DHW. (g) Annual maximum DHW for the northern GBR (blue), Coral Sea (orange), and Nouméa (grey). Dashed red line indicates the nominal 4°C-weeks bleaching threshold.

