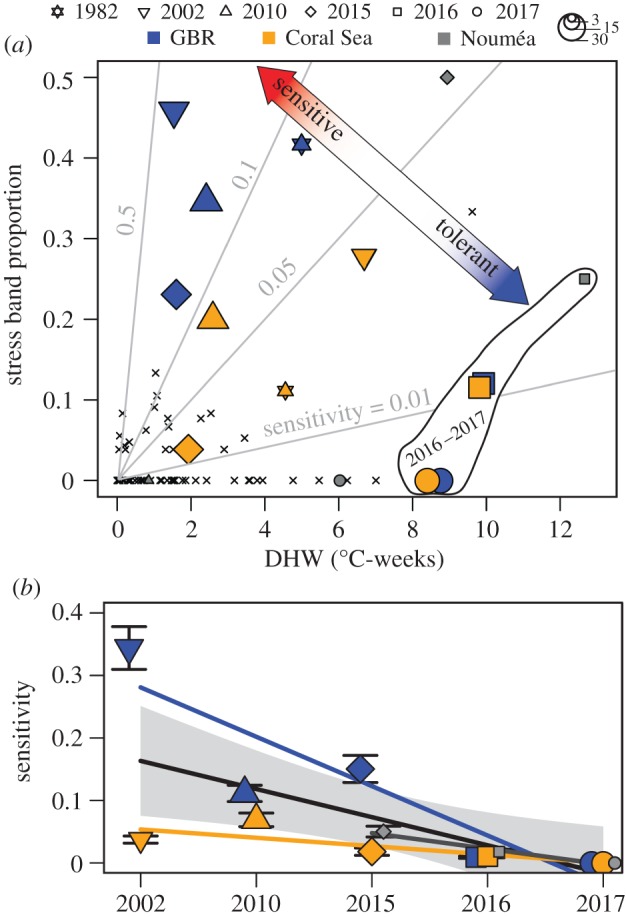
Figure 3.

Declining sensitivity to heat stress. (a) Proportion of cores with stress bands in all years of the satellite era (1982–2017, crosses) and the years with the most evidence of heat stress (symbols indicate year, colours indicate location, and symbol size indicates number of replicates). Light grey lines show constant sensitivities to heat stress, defined as the ratio of stress band proportion to maximum DHW. (b) Sensitivity to heat stress in the twenty-first century (colours are the same as a). Regression lines are shown for each region (blue, grey, and orange) and for the pooled data (black), with the grey error bound indicating the 95% confidence interval of the pooled fit. Error bars indicate uncertainty (1 σ) based on a 10% rate of false positives in stress band assignments.
