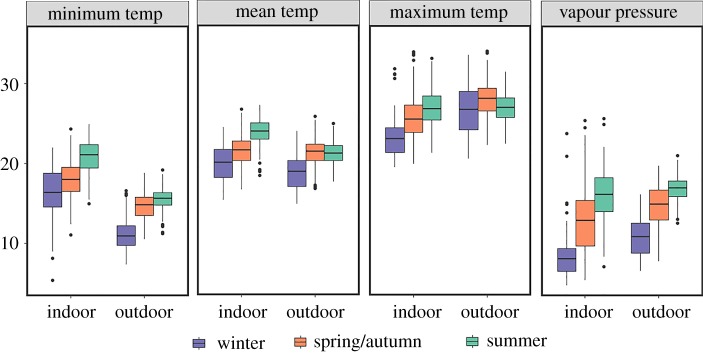
Figure 1.
Boxplots for the climatic variables air temperature (°C) and vapour pressure (hPa) by season (spring and autumn are averaged; winter = purple, spring/autumn = orange, summer = green) and location. Minimum temp is the mean minimum air temperature, mean temp is mean air temperature, maximum temp is the mean maximum air temperature and vapour pressure is the mean vapour pressure. The indoor climate is from our study homes and outdoor climate values are from the 100 grid cells that are the most climatically similar to the mean home indoor climate. The box plots display data range, quartiles and median with dots as outliers. Figure was generated with R (version 3.3.2; http://www.R-project.org) package ggplot2 (version 2.2.0; http://CRAN.R-project.org/package=ggplot2).

