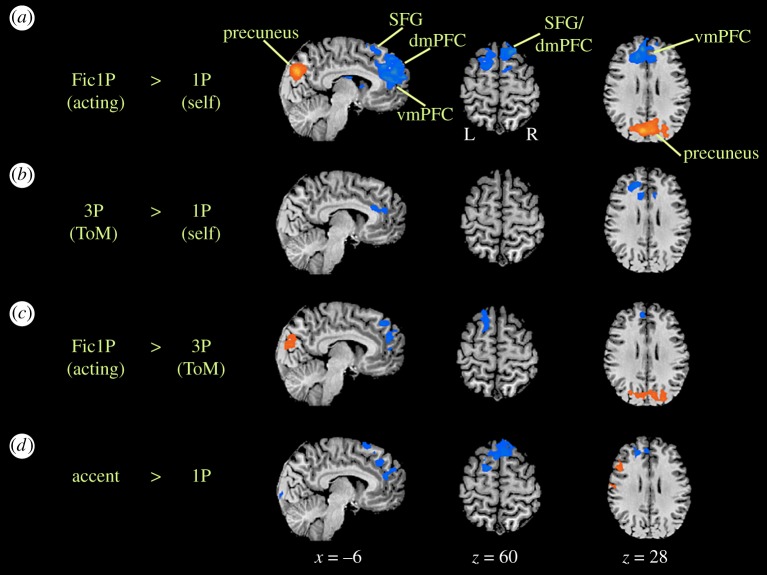
Figure 2.
High-level contrasts. Results are registered on the anatomical MRI of one of the participants (P9). (a) Acting (Fic1P) versus self (1P), (b) theory-of-mind (3P) versus self (1P), (c) acting (Fic1P) versus theory-of-mind (3P) and (d) British accent versus self (1P). These contrasts were thresholded with cluster-level correction for multiple comparisons to control for the rate of false positives. An initial cluster-forming threshold of p < 0.05 uncorrected was applied, followed by a Monte Carlo simulation using the AlphaSim algorithm in Brain Voyager, which selected a cluster-size threshold for each high-level contrast that maintained a family-wise error rate of p < 0.05. The obtained k-value (in voxels) was 100 for Fic1P versus 1P, 82 for 3P versus 1P, 90 for Fic1P versus 3P, 93 for accent versus 1P and 95 for Fic1P versus accent. dmPFC, dorsomedial prefrontal cortex; PCC, posterior cingulate cortex; SFG, superior frontal gyrus: vmPFC, ventromedial prefrontal cortex.

