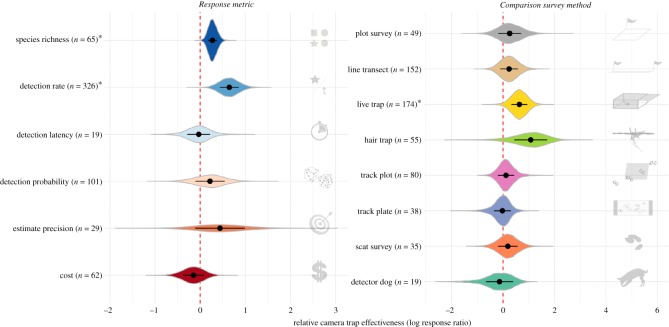
Figure 4.
Bootstrapped effect sizes for each metric and survey method, with the distribution of bootstrap estimates shown in each case with a violin plot. Asterisks after the labels indicate cases in which camera traps were significantly more effective than the methods they were compared with. Points and error bars indicate medians and standard errors. Sample sizes are the number of effect sizes extracted from the primary literature, with non-independence among effect sizes from the same study accounted for with stratification during each bootstrap. The red vertical dashed line at zero indicates no difference in effectiveness.

