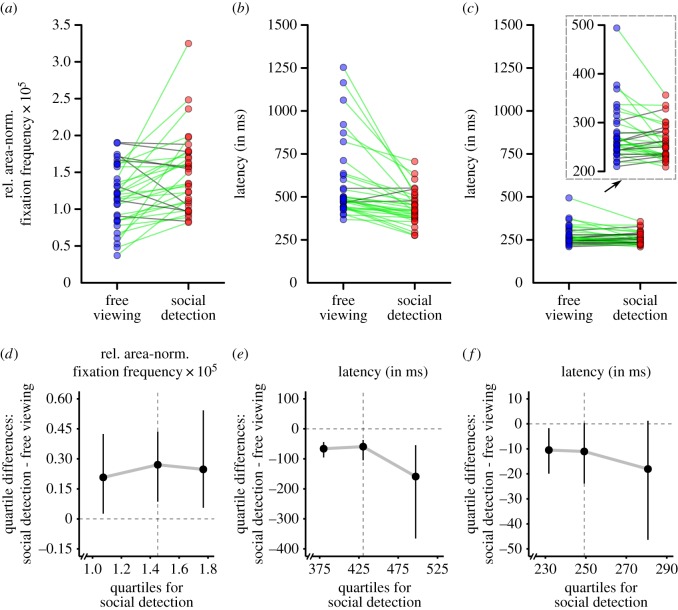
Figure 5.
Paired observations and shift functions. Top row: individual participant scores illustrated as paired observations between the two task conditions (free viewing versus spotting people as fast as possible) for three measures: (a) the relative area-normalized frequency of heads being fixated at the very first fixation after scene onset, (b) the median latency (in milliseconds) of heads being fixated for the first time, and (c) the median latency (in milliseconds) of fixating heads at the very first fixation after scene onset. Note: green links indicate paired observations with a numerical task difference in accordance with the overall sample statistics (see Results section); grey lines denote a reversed numerical task difference. For reasons of visibility, the scores for (c) are additionally illustrated with scales zoomed in to the corresponding ranges. Bottom row: shift functions (see Results section) for the difference in the distributions of individual participant scores between the two task conditions (free viewing versus spotting people as fast as possible) for three measures: (d) the relative area-normalized frequency of heads being fixated at the very first fixation after scene onset, (e) the median latency (in milliseconds) of heads being fixated for the first time, and (f) the median latency (in milliseconds) of fixating heads at the very first fixation after scene onset. Note: the shift functions display the differences between the quartiles for social detection and free viewing (y-axes) as a function of the first, second and third quartile for social detection (x-axes). Consequently, for each quartile of social detection, it is illustrated in which way and to which degree the corresponding quartile for free viewing would need to be shifted to match the corresponding quartile for social detection (see also [64]). Vertical bars denote 95% bootstrap confidence intervals. Vertical dashed lines mark the second quartiles (i.e. medians).

