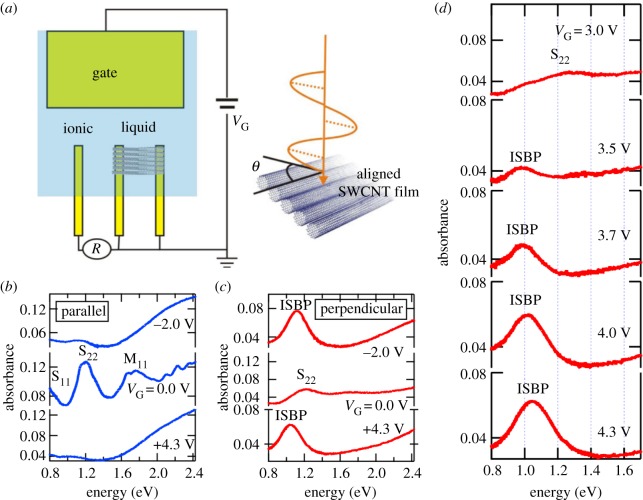
Figure 10.
ISBPs in gated aligned SWCNT films. (a) Schematic diagram for the set-up for the polarization-dependent absorption spectroscopy experiments on an aligned SWCNT film gated through electrolyte gating. VG: gate voltage, R: reference voltage. (b) Parallel-polarization and (c) perpendicular-polarization optical absorption spectra at different gate voltages for an aligned SWCNT film containing semiconducting and metallic nanotubes with an average diameter of 1.4 nm. The ISBP peak appears only for perpendicular polarization for both electron and hole doping, corresponding to VG =−2.0 and 4.3 V, respectively. (d) Optical absorption spectra showing how the ISBP peak evolves as the gate voltage increases. Adapted from [89].

