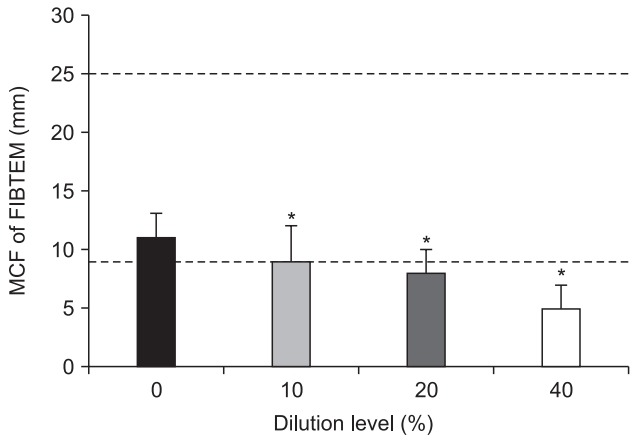
Fig. 3.

MCF of FIBTEM in each dilution group: 0% (black), 10% (grey), 20% (dark grey), and 40% (pale grey) diluted groups using a fluid composed of 2.7% sorbitol and 0.54% mannitol. Values are mean (SD). MCF: maximum clot firmness (mm). The short dash lines refer to the reference range. *Significant differences from 0% diluted group (P < 0.017).
