

Abstract
The aim of this study was to describe the game related statistics and match analysis of rugby world cups finals from 1987 to 2015. Video recordings of all (n = 8 matches) rugby world cup finals were used for the purpose of this study. Games were analysed using the video analysis software (Sports code V8.9, Sportstec, Australia) and supplementary data were collected from the official reports published by the International Rugby Board and from webpages of Rugby World Cups. Magnitude of differences between the winners and losers was assessed mechanistically. Only 5 tries in total were scored in the last 8 rugby world cup finals. The main two modes of scoring points were penalty kicks and drop goals. Winning teams attempted more penalty kicks, yet seemed to miss more. The number of drop goals was similar between winning and losing teams. These findings highlight the significance of having an on form place-kicker and from a defensive perspective, conceding fewer penalties in kickable positions. Winners of the Rugby World Cup final won more scrums and lost few line-outs, emphasising the importance of winning the set-pieces. Further establishment of these variables and their influence on performance may be used to evaluate team performances and plan more effective tactical approaches to competition
Key words: rugby union, game related statistics, performance team profiles
Introduction
When seen collectively, performance in a rugby team is complex and the question of how team and individual performances should be measured is a challenge. Evidence indicates that athletes experience different emotions before and during competition that may influence performance (Eaves et al., 2005). Competing at major international sporting events, such as the men’s rugby world cup final is always an extra source of motivation and has the potential to be extremely stressful. During competition, the emotions players experience will change over the time of a long-duration game (Nicholls et al., 2009). In rugby, studies observed differences in performance levels between halves (Vaz et al., 2015). Halftime is a key point where emotions could change and intrinsic or extrinsic motivation can influence this change (Martinent et al., 2013). It is important to educate elite rugby athletes in ways to cope with the variable stressors (e.g., coaches, game demands, certain sources of competitive anxiety) associated with their particular team subculture and performance environment (Campo et al., 2012).
The Rugby World Cup (RWC) is an international tournament which takes place every four years since 1987. The match characteristics of the RWC have evolved between 1995 and 2011,
i.e., ball-in-play increased by 33%, the number of passes increased from 179 to 263 per game (an increase of almost 50%), rucks/mauls increased from 69 to 162 per game, kicks decreased from 75 to 41 per game and scrums decreased from 27 to 17 per game (Vaz et al., 2015).
In terms of team performance, winning the RWC is the ultimate success. For this reason, a number of studies reporting the differences between winning and losing teams at the RWC have been published (Jackson, 2002; Ortega et al., 2009; van Rooyen, 2012; Vaz et al., 2010). The study by Standhope and Hughes (1997) revealed that the successful teams during the 1991 RWC performance recovered a higher number of balls at the ruck and had a more effective kicking strategy. Hunter and O´Donoghue (2001) compared the performance of winning and losing teams in the 1999 RWC and found significant differences in favour of winning teams in two of the eleven analysed variables: a) frequency with which the winner invaded the rival's 22-m zone, and b) points that these teams achieved each time that they invaded the rival's 22-m zone. In an attempt to identify a more focused direction for the analysis of rugby union, Hughes et al. (2012) used a large dataset from the 2011 World Cup from analysts working with national teams and combined this with examples of data taken from previous studies, it was concluded that in a complex dynamic interactive team sport such as rugby, simple analyses of frequency data, although informative, cannot possibly be expected to model this very difficult and multivariate problem.
Villarejo et al. (2015) investigated and compared the match-related statistics for the different playing positions based on the match outcome during the men´s 2011 RWC. The results demonstrated performance indicators that measured positive aspects of performance (kicks executed, tries, try assists, runs executed, kick return runs, metres gained per run, line breaks, and offload) as well as negative ones (pick up and drives, tackles executed, ineffective tackles and missed tackles) that discriminated between the final outcomes regarding playing positions.
More recently, Vaz et al. (2015) compared the scoring profile and game related statistics of the finalist during the different stages of the 2011 RWC. The study revealed significant differences in behaviours during the RWC competition when compared across all games played (n = 12) for two teams (New Zealand and France). The quantitative data tended to echo those of previous research emphasizing the predominant use of game related statistic observation as a conscious coaching tool. The discussion highlighted a number of explanations for the importance to use game related statistics as well as a lack of awareness regarding the use of observation. However, the same type of research has not been conducted into the measurement of performance team profiles and game related statistics used by rugby teams in competition.
Despite the research studies, insufficient data currently exist regarding the development and measurement of performance indicators in rugby union. In particular, there is little research concerning the performance teams and their subsequent performance profiles in RWC tournaments. Therefore, the purpose of this study was to describe the game related statistics and match analysis of rugby world cups finals from 1987 to 2015.
Methods
Sample
Video recordings of all final matches played during rugby world cups from 1987 to 2015 (n = 8 matches) were used in this investigation. Games were analysed using the video analysis software (Sportscode V8.9, Sportstec, Australia) and supplementary data were collected from the official reports published by the International Rugby Board, from webpages of the Rugby World Cup (www.rugbyworldcup.com) and from the webpage Rugbystats (http://www.rugbystats.com.au)
Data collection procedures
Video recordings of eight matches played during RWCs from 1987 to 2015 were analysed and used to quantify the counts of match activities as well as ball-in-play and rest duration. Supplementary data were collected from the official reports published by the International Rugby Board (2011), since 2014 known as World Rugby, from webpages of the Rugby World Cup (www.rugbyworldcup.com) and from the webpage Rugbystats (www.rugbystats.com.au) The companies in charge of collecting the information (Sportsdata Pty Ltd and Capgemini) by professional analysts followed a category system (Anguera et al., 2011) using a notational analysis procedure (Hughes and Franks, 2008). All games of the sample were viewed, checked for accuracy and reliability by cross-referencing actions post event from match video by five different experienced performance analysts (with 20 year experience in rugby performance analysis, research and coaching in rugby union) to verify and validate the information collected on the webpages and post event from match video.
Performance indicators
The formation of individual performance profiles through the utilization of key performance indicators is an important area of investigation. The development of performance indicators subsequently leads to the creation of performance profiles, which describe a pattern of performance by a team or individual analysed, typically created from collected frequencies of a combination of key performance indicators that offer some prediction of future performance (Hughes and Bartlett, 2002; Villarejo et al., 2014). The 39 team performance indicators (PI) can be categorised as either scoring indicators or indicators of the quality of the performance and were classified into seven groups: mode of scoring, set-pieces, defencive, ofencive, infringements, replacements and team/time possession efficiency (Table 1).
Table 1.
Performance indicators (PI) used in the analyses.
| Classification | Team performance indicators |
|---|---|
| Mode of scoring | Points scored, points conceded, number of tries scored, number of conversion goal, number of conversions missed, penalties goals (attempts), penalties goals (missed) and number of drop goals |
| Set-pieces | Scrums (number, won and lost) and line-outs (number, won and lost) |
| Defencive | Tackles (attempted, made and missed), turnovers (number, won (at ruck/maul) and handling errors (defence) |
| Ofencive | Passes completed, number (rucks/mauls), kicks to line-out, possession kicked and handling errors (attack) |
| Infringements and replacements | Free kicks conceded, penalty kicks conceded, forward passes, offloads, sin bin/yellow and red cards and replacements |
| Team/time possession efficiency | Total seconds (duration of the match). Total seconds (possession), Seconds in possession and seconds in opponent´s half |
Reliability
The results reflected reliability of .96 (Intraclass correlation coefficient). The reliability of the coding was determined by the re-analysis method (test-retest reliability), for inter-rater reliability (James et al., 2005). We re-analysed some incorrect definitions that could be by different terminology in the template that coders used to describe match events, faults in the programme used to filter information from the main database, or incorrect coding due to human error. This method entails that a different analyst performs a re-analysis of the video material and the data collected from the official reports on webpages of the Rugby World Cup (www.rugbyworldcup.com) and Rugbystats (http://www.rugbystats.com.au) one month after the original analysis.
For the purpose of this study, all eight final rugby world cup matches were re-analysed by five different experienced performance analysts. Inter-rater agreement was interpreted as follows: poor (0 – 0.20), fair (0.30 – 0.40), moderate (0.50 – 0.60), strong (0.70 – 0.80), and almost perfect (>0.80) (Streiner and Norman, 2003). Data capturing was carried out by the SAS Software Ltd. Company (http://www.sas.com) and data registry was completed at once. The data from each game were converted to a spreadsheet (Microsoft excel) and were then exported to the SPSS version 22.0 (IBM Corporation, Armonk, New York, USA).
Statistical analysis
Data were graphically presented as means and standard deviations. Before the statistical test procedure, the assumptions of normality and homogeneity of variance were verified. An independent sample t-test was used to compare the considered variables according to the match final outcome, i.e. winners vs. losers. Additionally, the effect sizes (ES) were calculated and their interpretation was based on the following criteria: < 0.20 = trivial, 0.20–0.59 = small, 0.60–1.19 = moderate, 1.20–2.0 = large, and > 2.0 = very large (Hopkins et al., 2009). For the time possession variables, a descriptive interpretation was made since the outcomes corresponded for a single match observation. The statistical analyses were performed using the statistical software SPSS, version 22.0 (IBM Corporation, Armonk, New York, USA) and statistical significance was set at .05.
Results
Figure 1 depicts the results for scoring modes when comparing the winning and losing teams. Statistically significant higher values for winning teams were found in the following variables: pointes scored (p < 0.05; ES = 1.2, moderate), number of tries (p < 0.05; ES = 0.8, moderate), penalties goals attempts (p < 0.05; ES = 0.8, moderate) and penalties goals missed (p < 0.05; ES = 0.7, moderate). On the other hand, significant higher values were found for loser teams in points conceded (p < 0.05; ES = 1.2, moderate).
Figure 1.
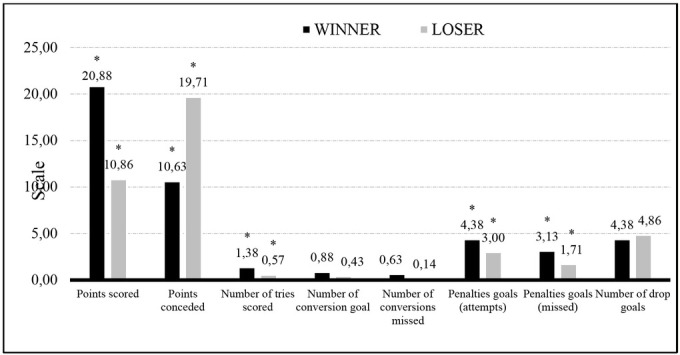
Mode of scoring.
* Significant differences at p < .05
Results for set-pieces showed statistically significant higher values for winning teams in the number of scrums won (p < 0.05; ES = 0.4, small) and higher values for losers in the number of line-outs lost (p < 0.05; ES = 0.4, small) (Figure 2).
Figure 2.

Set-pieces.
* Significant differences at p < .05
Statistical differences were found in defence with higher values for winning teams in the number of tackles made (p < 0.05; ES = 0.0 trivial) and higher values for losing teams in handling errors in defence (p < 0.05; ES = 0.8, moderate) (Figure 3).
Figure 3.

Defencive.
* Significant differences at p < .05
Figure 4 shows the results in ofensive and statistically significant higher values were found in losing teams in the following variables: passes completed (p < 0.05; ES = 0.9, moderate), the number of rucks and mauls won (p < 0.05; ES = 0.2, small) and in handling errors in attack (p < 0.05; ES = 2.2, very large). Statistically significant higher values were found for winning teams in kicks to line-out (p < 0.05; ES = 0.7, moderate). Results for infringements and replacements showed statistically significant higher values for losing teams in replacements (p < 0.05; ES = 0.5, small) (Figure 5). For the time possession variables, a descriptive interpretation was made since the outcomes corresponded for a single match observation (Figure 6).
Figure 4.
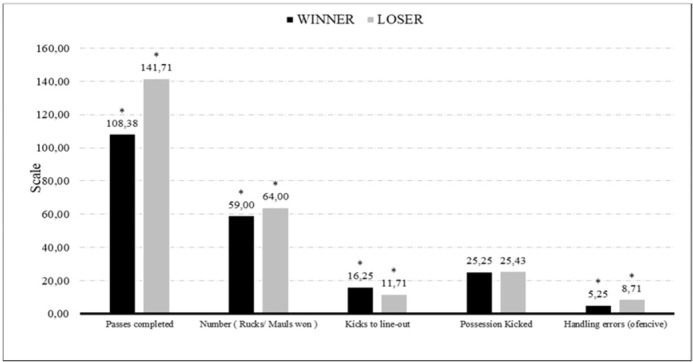
Ofencive
* Significant differences at p < .05
Figure 5.
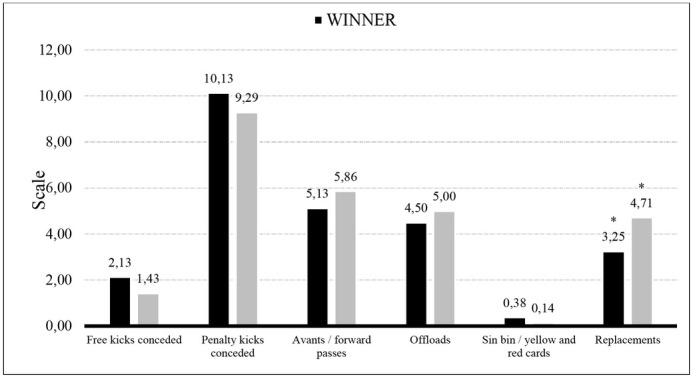
Infringements and replacements.
* Significant differences at p < .05
Figure 6.
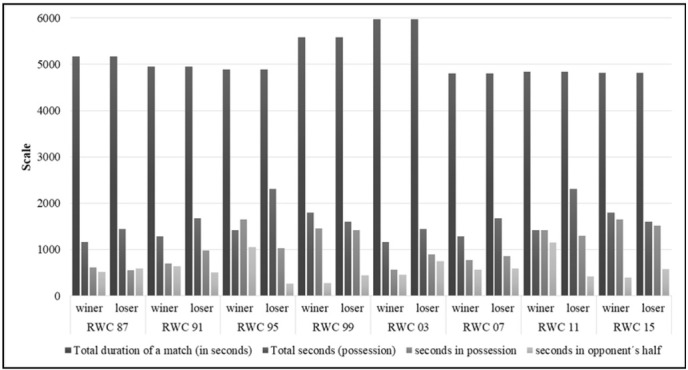
Winner vs loser time possession efficiency.
Discussion
Emotions are dynamic in nature and influence behaviors. In sport, players’ behaviors are directly associated with performance. Given the potential influence of emotions on performance, researchers should seek to develop better measures of performance that would allow a meaningful analysis of emotion – performance relationships. Therefore, in examining relationships between emotions and performance, the potential influence of contextual variables such as the Rugby World Cup final should be considered. In addition, research that has investigated the quality of performance in team sports in relation to emotions (Campo et al., 2012; Hanin, 2000; Rathschlag and Memmert, 2013) used a number of different indicators (e.g. outcome of the game, match play statistics, performance of a specific task, physical performances). Yet, these ways of measuring performance might not be sufficiently sensitive to detect the relatively subtle influence of emotions.
With regard to the game outcome, it is misleading to assume that all teammates share the same emotional state. Practitioners should realize the importance of identifying stressors athletes perceive in their sport, pre, during, and post competition, and provide an array of specific coping responses and interventions to help athletes manage or alter their environment in order to foster development as individuals and athletic performers (Nicholls et al., 2006)
Winning the Rugby World Cup final is the ultimate measure of team success and associated with national pride. As expected, the last 8 RWC finals were tightly contested and not high scoring matches. Only 5 tries in total were scored in the last 8 RWC finals. The main two modes of scoring points were penalty kicks and drop goals. Winning teams attempted more penalty kicks, but seemed to miss more. The number of drop goals was similar between winning and losing teams. These findings highlight the significance of having an on form place-kicker and from a defensive perspective, conceding fewer penalties in kickable positions. Winners of the Rugby World Cup Final won more scrums and lost few line-outs, emphasising the importance of winning the set-pieces (Bremner et al., 2013). It is worth noting that the location and time of winning/losing the set-piece may also be key in distinguishing the winners from the losers, however, such analysis was beyond the scope of the current dataset.
From a defensive perspective, winning teams attempted and completed more tackles. Studies on rugby union (Hendricks et al., 2013; Ortega et al., 2009; Vaz et al., 2010) have found that success in rugby union competition is dependent partly on the defensive strategies of a team. On attack, losing teams completed more passes and offloads, and were involved in more rucks and mauls. In agreement with previous research (Wheeler et al., 2013), the results from the current study support the hypothesis that identifying the relative effectiveness of such strategies allows understanding of rugby match behaviour and may be applied to improve organisation, training tactical strategies, teaching and learning the game. Both winning and losing teams, however, share similar times in possession of the ball.
In summary, these findings suggest that for the Rugby World Cup final, defensive play may have a greater impact on the outcome of the match than attacking play and suggest that a kicking based game supported by an effective defensive structure is more likely to lead to winning a match than a possession based game. Studies on rugby union (Bishop and Barnes, 2013; Hawkes, 2011; Lim et al., 2011; Seuront, 2013) typically show that approximately 50% of the game is spent defending, therefore, success in rugby union is to a large degree dependent on the defensive strategies of a team.
Teams display increasingly complex match strategies and tactics. On the other hand, there is not enough empirical evidence available for training effective defensive strategies. Interestingly, losers of the Rugby World Cup final made more replacements than the winners.
The coaching staff of losing teams may make more substitutions in an attempt to change the impeding outcome of the match. However, this may be counter-productive as the replacements may require time to adjust to the tempo of the game. In a similar vein, winning teams may purposefully not be making as many changes in order to maintain the flow and advantage of the game.
Practical applications to training
Rugby coaches could control some reference values from these variables to prepare practices according to rugby competition demands. Given the potential influence of emotions on performance, contextual variables should be considered by coaches and athletes that would allow a meaningful analysis of emotion–performance relationships.
The analysis of game related statistics, with regard to collective skills, is one of the tools that can be utilised to describe and monitor behaviours in competition. This type of information is useful in providing greater knowledge of the rugby game.
Conclusions
A better understanding of game related statistics, emotions and match analysis of rugby union match play is required to improve the analysis of individual and team performance characteristics and implement a systematic approach to the development of position specific training programs. Further establishment of these variables and their influence on performance may be used to evaluate team performances and plan more effective specific approaches to competition. Moreover, it will permit appropriate training to be established to optimize individual and team performance.
There is greater match-to-match variability in performance indicator values within than between international rugby teams.
The priorities for rugby union team’s technical and tactical preparation should reflect the magnitude of the relationships between performance indicators, points scoring and the likelihood of winning.
References
- Anguera MT, Blanco A, Hernández-Mendo A, Losada JL. Observational design and its applications in the field of sports psychology. Cuadernos de Psicología del Deporte. 2011;2(11):63–76. [Google Scholar]
- Bishop L, Barnes A. Performance indicators that discriminate winning and losing in the knockout stages of the 2011 Rugby World Cup. Int J Perf Anal Spor 2013. 13(1):149–159. [Google Scholar]
- Bremner S, Robinson G, Williams MD. A Retrospective Evaluation Of Team Performance Indicators In Rugby Union. Int J Perf Anal Spor. 2013;13(2):461–473. [Google Scholar]
- Campo M, Mellalieu S, Ferrand C, Martinent G, Rosnet E. Emotions in Team Contact Sports: A Systematic Review. Sport Psychol. 2012;26(1):62–97. [Google Scholar]
- Eaves JS, Hughes DM, Lamb LK. The Consequences of the Introduction of Professional Playing Status on Game Action Variables in International Northern Hemisphere Rugby Union Football. Int J Perf Anal Spor. 2005;5(2):58–86. [Google Scholar]
- Hanin YL. Emotions in sport Human Kinetics. 2000.
- Hawkes C. Rugby World Cup 2011: the official guide. London: Carlton; 2011. [Google Scholar]
- Hendricks S, Roode B, Matthews B, Lambert M. Defensive Strategies in Rugby Union. Percept Motor Skill. 2013;117(1):65–87. doi: 10.2466/30.25.pms.117x17z6. [DOI] [PubMed] [Google Scholar]
- Hopkins WG, Marshall SW, Batterham AM, Hanin J. Progressive statistics for studies in sports medicine and exercise science. Med Sci Sport Exer. 2009;41:3–12. doi: 10.1249/MSS.0b013e31818cb278. [DOI] [PubMed] [Google Scholar]
- Hughes M, Franks IM. The Essentials of Performance Analysis. An Introduction. 2008 [Google Scholar]
- Hughes M, Williams J, James N, Vuckovic G, Locke D. Performance indicators in rugby union. Journal of Human Sport Exercise. 2012;7:383–401. [Google Scholar]
- Hughes MD, Bartlett RM. The use of performance indicators in performance analysis. J Sport Sci. 2002;20(10):739–754. doi: 10.1080/026404102320675602. [DOI] [PubMed] [Google Scholar]
- Hunter P, O´Donoghue P. A match Analysis of the 1999 Rugby Union World Cup. Books of abstracts Fifth World Congress of performance analysis in sports. 2001. pp. 85–90. Eds: Hughes, M.D. and Franks.
- Jackson RC. Consistency of pre-performance routines: analysis of the 1999 Rugby World Cup. J Sport Sci. 2002;20(1):21–22. [Google Scholar]
- James N, Mellalieu SD, Jones NM. The development of position-specific performance indicators in professional rugby union. J Sports Sci. 2005;23(1):63–72. doi: 10.1080/02640410410001730106. [DOI] [PubMed] [Google Scholar]
- Lim E, Lay B, Dawson B, Wallman K, Anderson S. Predicting try scoring in super 14 rugby union - the development of a superior attacking team scoring system. Int J Perf Anal Spor. 2011;11(3):464–475. [Google Scholar]
- Martinent G, Nicolas M, Gaudreau P, Campo M. A cluster analysis of affective states before and during competition. J Sport Exerc Psychol. 2013;35(6):600–611. doi: 10.1123/jsep.35.6.600. [DOI] [PubMed] [Google Scholar]
- Nicholls AR, Backhouse SH, Polman RC, McKenna J. Stressors and affective states among professional rugby union players. Scand J Med Sci Sports. 2009;19(1):121–128. doi: 10.1111/j.1600-0838.2007.00757.x. [DOI] [PubMed] [Google Scholar]
- Nicholls AR, Holt NL, Polman RCJ, Bloomfield J. Stressors, coping, and coping effectiveness among professional rugby union players. Sport Psychol. 2006;20(3):314–329. [Google Scholar]
- Ortega E, Villarejo D, Palao JM. Differences in game statistics between winning and losing rugby teams in the Six Nations Tournament. J Sport Sci Med. 2009;8(4):523–527. [PMC free article] [PubMed] [Google Scholar]
- Rathschlag M, Memmert D. The influence of self-generated emotions on physical performance: an investigation of happiness, anger, anxiety, and sadness. J Sport Exerc Psychol. 2013;35(2):197–210. doi: 10.1123/jsep.35.2.197. [DOI] [PubMed] [Google Scholar]
- Seuront L. Complex dynamics in the distribution of players' scoring performance in Rugby Union world cups. Physica A. 2013;392(17):3731–3740. [Google Scholar]
- Standhope J, Hughes M. An analysis of scoring in the 1991 rugby union world cup. Notational Analysis of Sports. 1997;III:58–74. [Google Scholar]
- Streiner DL, Norman GR. An introduction to the statistical developments and applications section. J Pers Assess. 2003;80(1):3–3. doi: 10.1080/00223891.2014.932284. [DOI] [PubMed] [Google Scholar]
- van Rooyen MK. A Statistical Analysis of Tackling Performance during International Rugby Union Matches from 2011. Int J Perf Anal Spor 2012. 12(3):517–530. [Google Scholar]
- Vaz L, Van Rooyen M, Sampaio J. Rugby game-related statistics that discriminate between winning and losing teams in IRB and Super twelve close games. J Sport Sci Med. 2010;9(1):51–55. [PMC free article] [PubMed] [Google Scholar]
- Vaz L, Vasilica I, Kraak W, Arrones LS. Comparison of scoring profile and game related statistics of the two finalist during the different stages of the Rugby World Cup. Int J Perf Anal Spor 2015. 15(3):967–982. [Google Scholar]
- Villarejo D, Ortega E, Gomez MA, Palao JM. Design, validation, and reliability of an observational instrument for ball possessions in rugby union. Int J Perf Anal Spor. 2014;14(3):955–967. [Google Scholar]
- Villarejo D, Palao JM, Ortega E, Gomez-Ruano MA, Kraak W. Match-related statistics discriminating between playing positions during the men's 2011 Rugby World Cup. Int J Perf Anal Spor. 2015;15(1):97–111. [Google Scholar]
- Wheeler KW, Mills D, Lyons K, Harrinton W. Effective Defensive Strategies at the Ruck Contest in Rugby Union. Int J Sports Sci Coa. 2013;8(3):481–491. [Google Scholar]