
Figure 2.
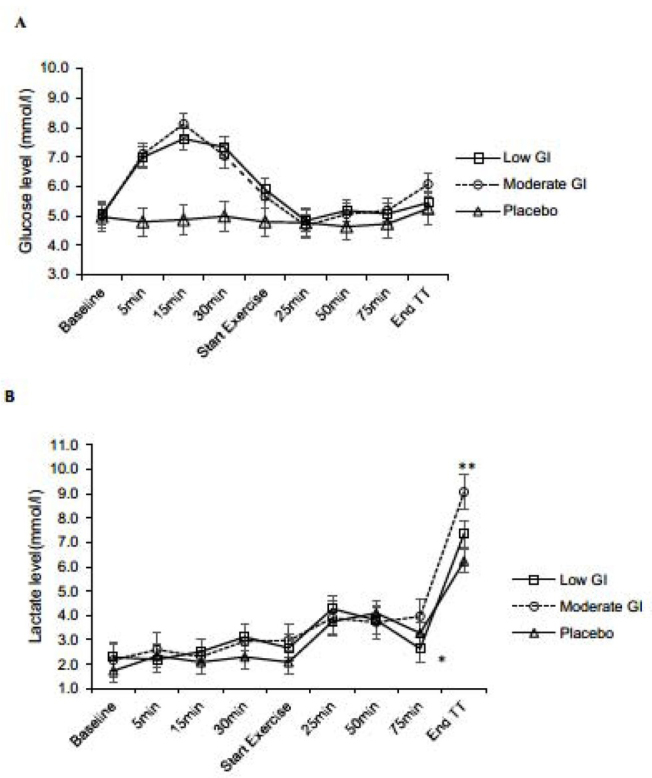
A) Plasma glucose concentration and B) lactate vs. time, at: baseline, postprandial and during exercise. Values are mean and error bars are SD.
Blood glucose was lower in the placebo compared to the bar conditions (p<0.01)
*Blood lactate was higher in the moderate-GI condition versus the low-GI condition (p<0.01)
**Blood lactate was higher in the moderate-GI condition versus the low-GI and placebo conditions (p<0.01)