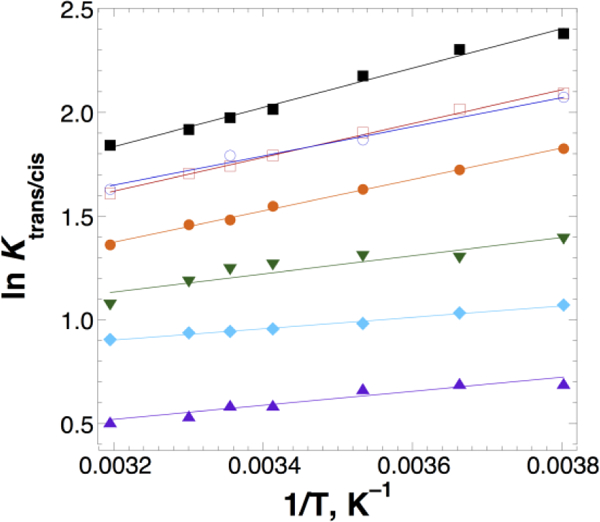
Figure 3.

van’t Hoff analysis of the temperature dependence of Ktrans/cis for the peptides R–C(O)–Hyp(4-NO2-Bz)-OMe. From top to bottom, R = –CH(CH3)2 (black squares),–CH2CH3 (open red squares), –CH2Cl (open blue circles), –CH3 (orange circles), –CH2OCH3 (green inverted triangles), –CH2F (cyan diamonds), –H (purple triangles).
