Fig. 4.
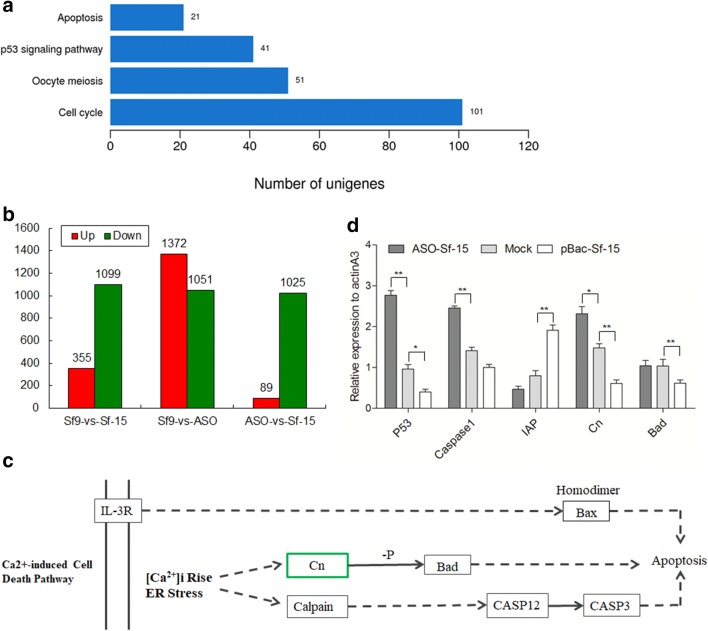
The potential targets of Sf-15. a KEGG pathway analysis of genes related to cell growth and death, which showed the numbers of genes in different signal pathways. b Numbers of genes with significantly varied expression upon Sf-15 repression and overexpression in Sf9 cells. Sf9 means normal Sf9 cells, Sf-15 represents cells transfected with the overexpression vector of pBac[A3-EGFP-A3-BmSf-15] (pBac-Sf-15). ASO means cells transfected with the antisense oligonucleotide of Sf-15. Red means the expression of genes were increased, green means the expression of genes were decreased. c Detailed information of genes in Ca2+ induced cell death pathway after overexpression of Sf-15 in Sf9 cells. Green box represented the expression of this gene was decreased upon Sf-15 overexpression but increased when Sf-15 was knocked down. d Quantitative real-time PCR results of genes in apoptosis pathway after transfection of Sf-15 antisense oligonucleotides (ASO) and overexpression vector pBac[A3-EGFP-A3-Sf-15] (pBac-Sf-15). IAP represented the inhibitor of apoptosis gene. actinA3 was used as an internal control

