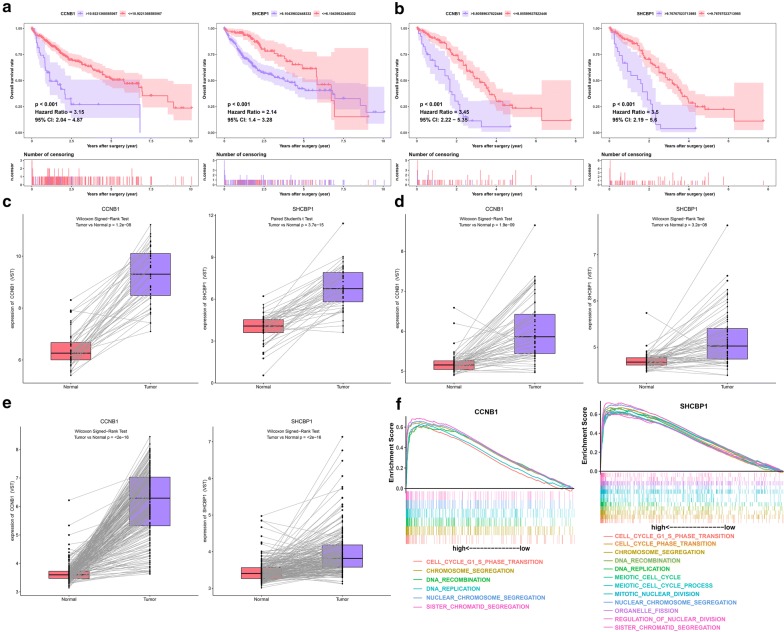
Fig. 4.
Survival analysis for DEmiRNAs. Kaplan–Meier survival curves for DEmRNAs in the TCGA (a) and meta-GEO (b) HCC cohorts. The horizontal axis indicates the overall survival time in years, and the vertical axis indicates the survival rate. The expression pattern of DEmRNAs in the TCGA (c), GSE64041 (d) and GSE14520 (e) HCC cohorts of paired HCC samples. Gene set enrichment analysis of DEmRNAs (f)

