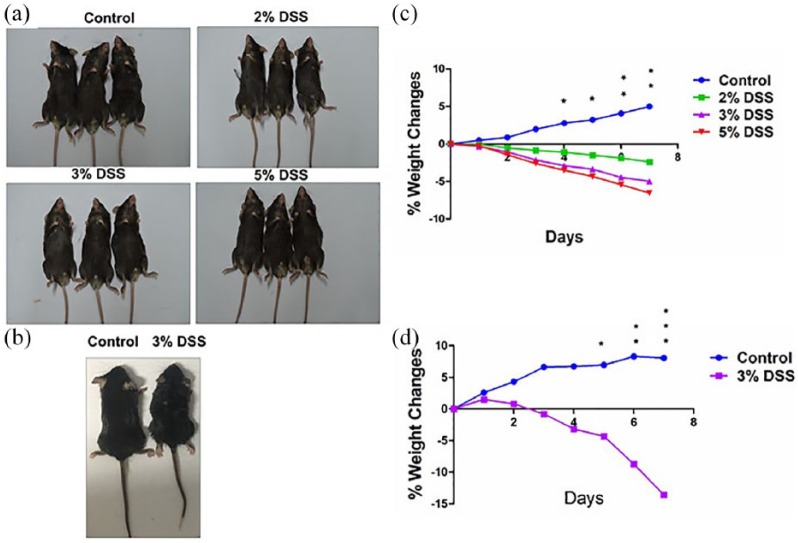
Figure 1.
Observation of DSS administration in mice. (a) Representative schematic of the mice treated by different concentrations of DSS in cohort 1. (b) Representative schematic of the mice treated by 3% DSS in cohort 2. (c) Comparison of the weight changes in mice treated by different concentrations of in cohort 1. (d) Comparison of the weight changes in mice treated by 3% DSS in cohort 2. Data were presented as mean ± SEM of two experiments. *P < 0.05; **P < 0.01; ***P < 0.001.

