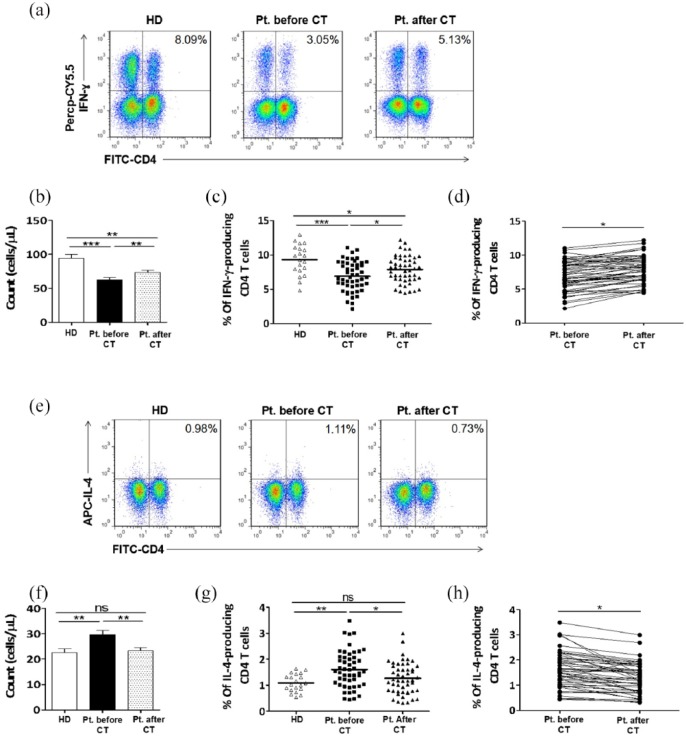
Figure 2.
Chemotherapy had positive and negative impacts on the number and frequency of Th1 cells and Th2 cells, respectively. PBMCs were collected from peripheral blood samples of 20 healthy donors and from 50 patients with NSCLC patients before and after chemotherapy. (a, e) Representative staining patterns of IFN-γ (a) and IL-4 (e) production by CD4+ T cells (CD3+ gated) of one healthy donor and one patient before and after two cycles of chemotherapy. (b, c) The absolute number (b) and frequency (c) of Th1 cells in the peripheral blood of healthy donors and patients with NSCLC before and after chemotherapy. (f, g) The absolute number (f) and frequency (g) of Th2 cells in the peripheral blood of healthy donors and patients with NSCLC before and after chemotherapy. (d, h) Representing the impact of chemotherapy on the frequencies of Th1 cells (d) and Th2 cells (h) in peripheral blood of patients with NSCLC. HD: healthy donor; CT: chemotherapy.

