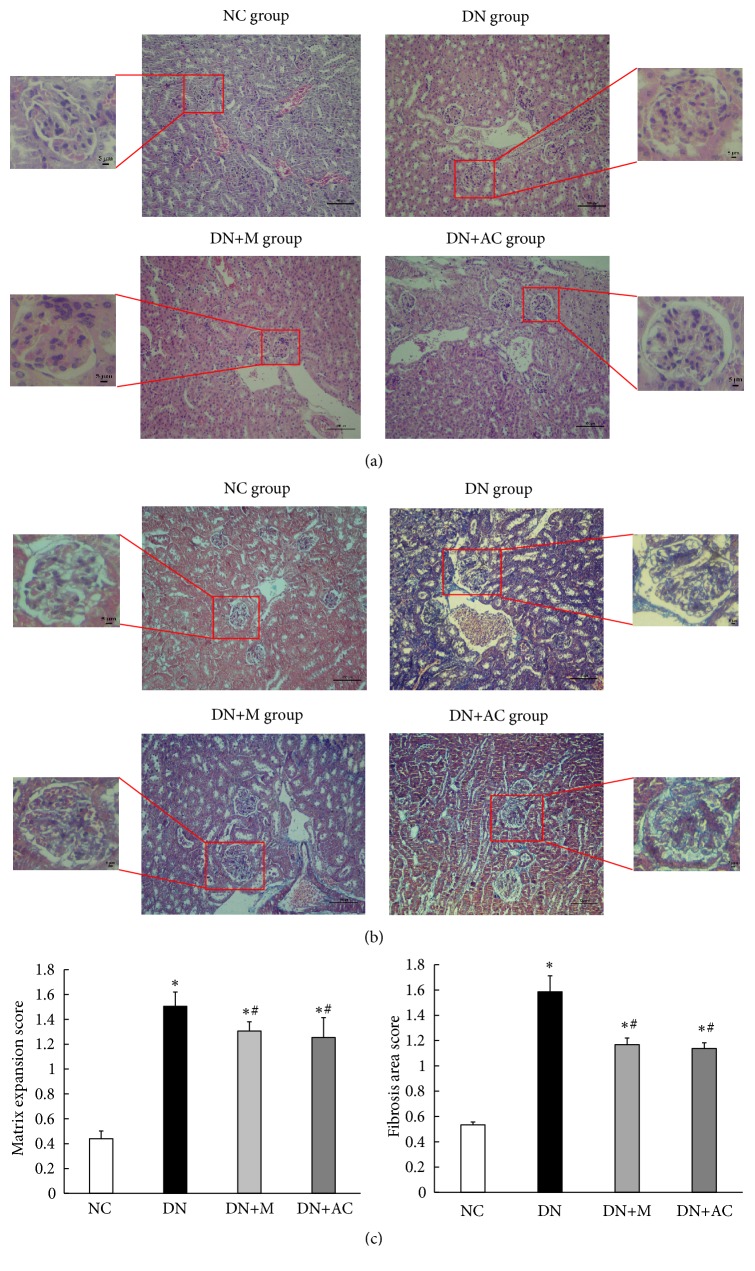
Figure 2.
Renal tissue morphology in four groups of mice. Mice were divided into the NC group, DN group, DN+M group, and DN+AC group. (a) H&E staining of renal tissue morphology in four groups of mice. (b) Masson's staining of renal tissue morphology in four groups of mice. Large figures (200 x), scale bar, 100 μm, and small figures (400 x), scale bar, 5 μm. (c) Matrix expansion and area of fibrosis were semiquantitatively analyzed from 30 glomeruli per mouse with 5 mice in each group. ∗: P<0.05 compared with the NC group; #: P<0.05 compared with the DN group, one-way analysis of variance.

