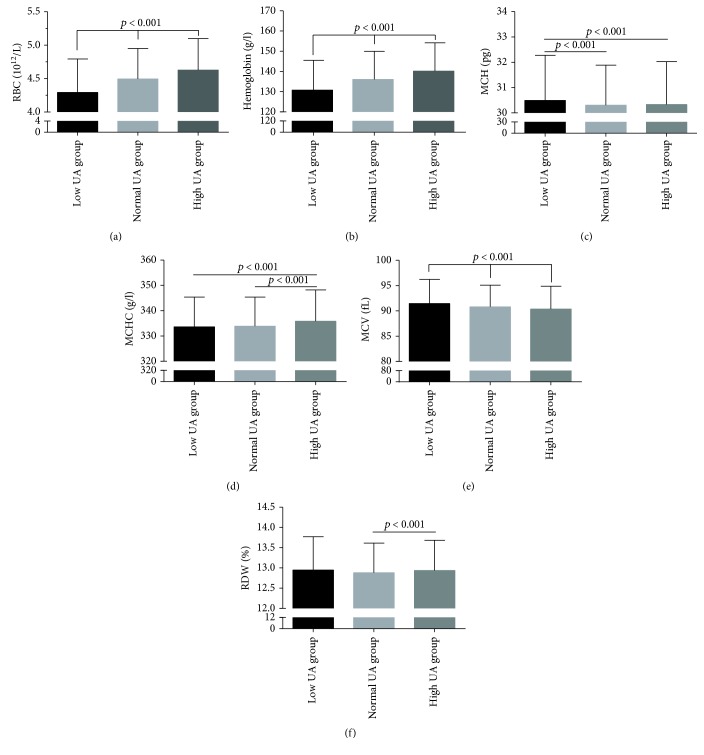
Figure 1.
Comparison of RBC parameters in subjects, stratified according to the level of UA. Top of the box plot represents the mean and the bar of each box represents the standard deviation. RDW: red blood cell distribution width; MCH: mean corpuscular hemoglobin; MCHC: mean corpuscular hemoglobin concentration; MCV: mean corpuscular volume; RBC: red blood cell count; UA: uric acid.

