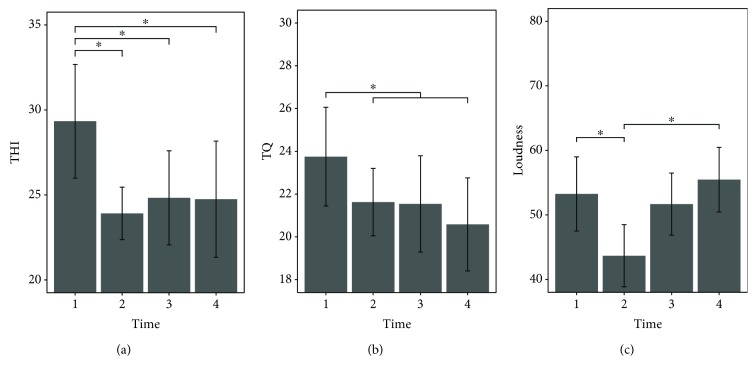
Figure 1.
Barplots showing tinnitus-related symptoms before (t1), 1 week after (t2), 3 months after (t3), and 6 months after (t4) neurofeedback training. Error bars represent ±1 standard error for within-subject designs according to Morey [60]. THI scores (a) showed significant decreases from t1 to t2, and differences between t1 and the two follow-up time points were significant. TQ scores (b) were significantly higher before (t1) than after the neurofeedback intervention (t2-t4). For tinnitus loudness (c), a significant decrease between t1 and t2 was found followed by a significant increase to t4.

