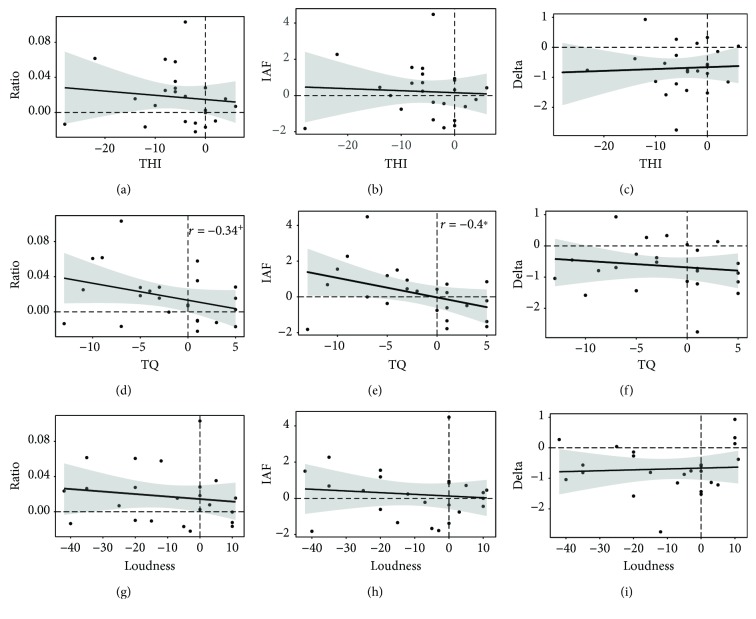
Figure 4.
Scatterplots of difference scores (t2-t1) of EEG-WT resting-state data ((a, d, g) alpha/delta ratio; (b, e, h) rewarded individual alpha band power; (c, f, i) inhibited delta band power) and tinnitus-related symptoms ((a–c) THI; (d–f) TQ; (g–i) tinnitus loudness). The plots show the fitted regression lines with 95% confidence intervals. The correlation between IAF and TQ difference scores is statistically significant (p > .05).

