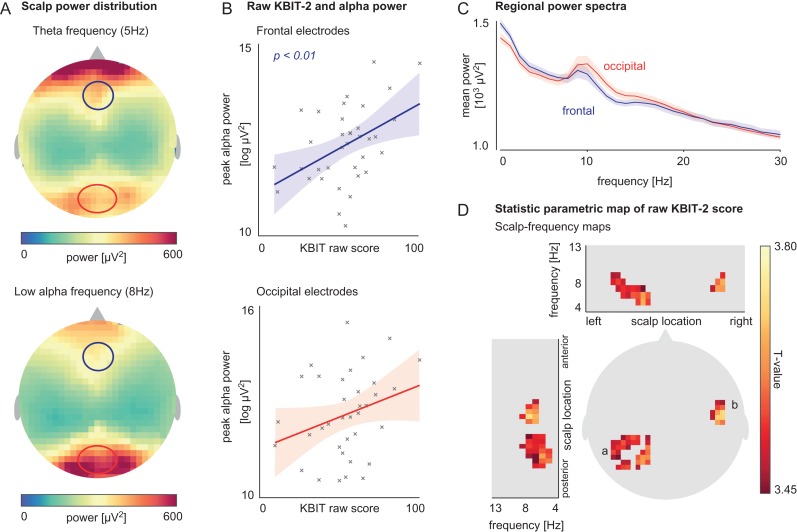
Figure 2.
A. Mean scalp map of power distribution for theta (5 Hz, top) and low-alpha (8 Hz, bottom) activity. The frequencies shown here are exemplary and chosen for their complementary distribution across the scalp (all statistical inference is made across the whole theta–alpha spectrum). B. Linear relationship between peak alpha amplitude at frontal and occipital regions (eight channel average frontal; seven channel average occipital) and raw KBIT-2 score. C. Mean regional power spectra at frontal and occipital regions (regional channel average). D. T-statistic scalp map showing voxels with a significant relationship between raw KBIT-2 score and power in theta–alpha (4–13 Hz) range; voxels were located over left occipital (a) and right temporal (b) scalp regions.

