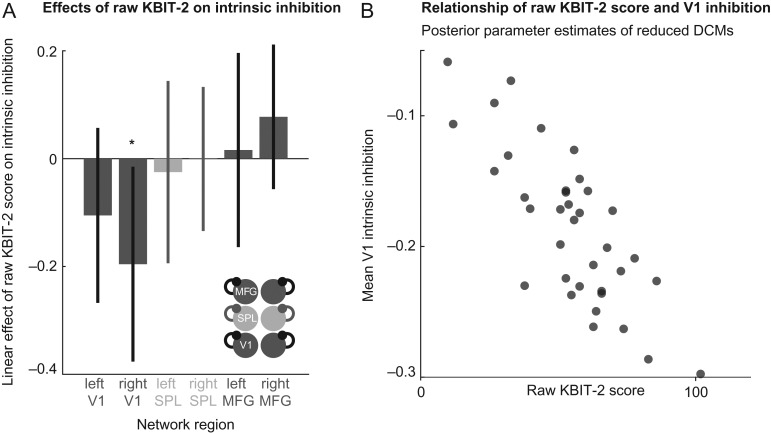
Figure 5.
A. Bar chart showing the linear (between-subject) effect of raw KBIT-2 score on intrinsic self-inhibition for each node in the network of the winning model (allowing for changes in intrinsic self-inhibition alone; shown bottom right). Bayesian confidence intervals indicate that the effects estimated with most certainty are located at right V1. B. Scatter graph showing inverse correlation between raw KBIT-2 score and mean V1 (left V1 and right V1 average) intrinsic inhibition of the winning model (i.e., the model with the highest model evidence in model space).

