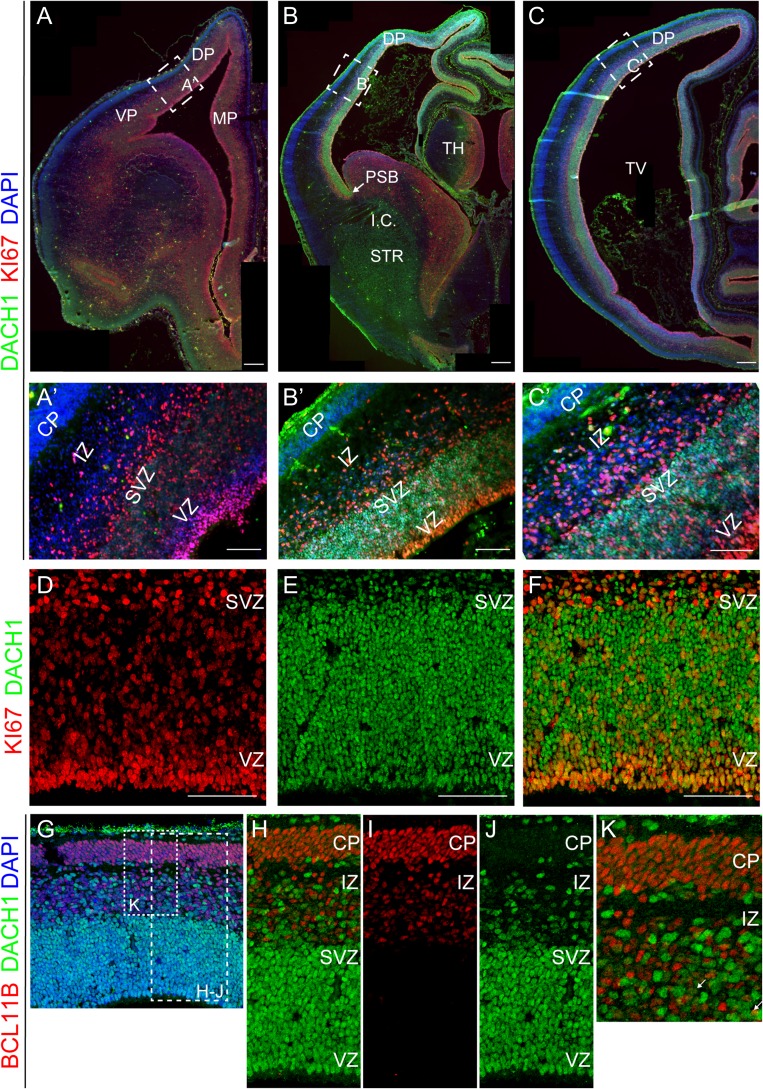
Figure 1.
Expression pattern of DACH1 in the human fetal cerebral cortex at 10 pcw. (A–C) Rostro-caudal expression pattern for DACH1 compared with KI67+ proliferative cells. DACH1 shows a very low expression in rostral sections (frontal cortex) (A), and a higher expression when moving towards the paracentral (B) and occipital cortex (C). (A’–C’) Higher magnification of the boxes in A–C showing the strong DACH1 expression in more caudal sections. DACH1 is expressed in the ventricular/subventricular zone (VZ/SVZ) where KI67+ proliferative cells reside. In the cortical plate (CP) there is no discernible expression. (D–F) High magnification of DACH1 and KI67 expression in the dorsal pallium (DP) VZ/SVZ (caudal level) showing that they are coexpressed in these proliferative regions. The images are from the DP of a section adjacent to the one shown in (B). Some DACH1+ cells are KI67−, probably migrating neuroblasts. (G–K) DACH1 expression in the DP compared with BCL11B (CTIP2), a layer 5 marker. The 2 proteins are expressed in a complementary fashion. (H–J) High magnification of the region highlighted in the dashed box in (G), showing DACH1 expression in the VZ/SVZ and scattered in the intermediate zone (IZ), compared with BCL11B expression in the CP and IZ. (K) High magnification of the region highlighted in the dashed box in (G), showing the complementary expression pattern of DACH1 and BCL11B. Arrows in K point to occasional single cells coexpressing both BCL11B and DACH1. VP, ventral pallium; MP, medial pallium; TV, telencephalic ventricle; PSB, pallium–subpallium boundary; TH, thalamus; STR, striatum; I.C., internal capsule. Scale bars: 100 μm in A–C, 50 μm in A’–F.

