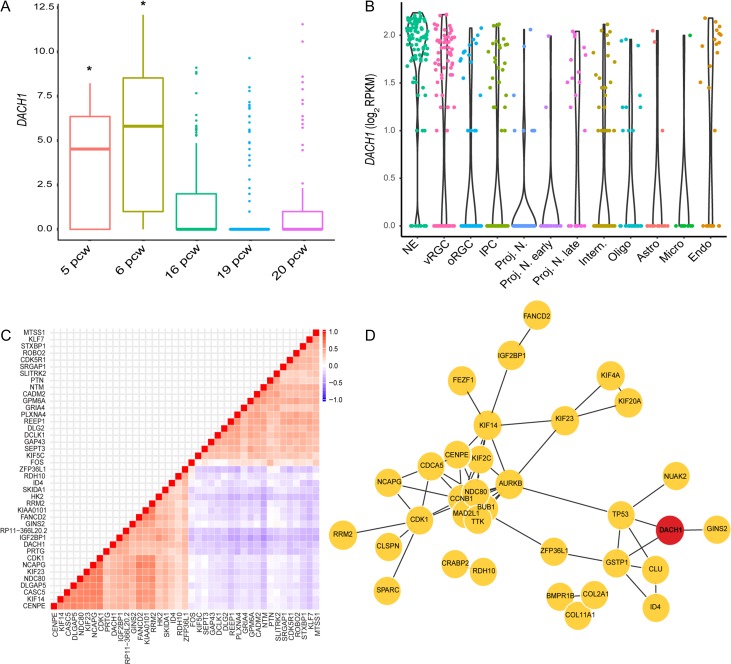
Figure 3.
Single-cell transcriptional profiling of DACH1 expression in the developing human neocortex. (A) Boxplot showing pseudotemporal ordering of cells by DACH1 expression from 5 to 20 pcw, with a significant decrease in DACH1 expression during neocortical development. (*P-adj. < 0.001, one-way ANOVA with Tukey post hoc test). (B) Violin plots showing expression of DACH1 in different cell types of the developing neocortex. DACH1 has a significantly higher expression (P-adj. < 0.001, Wilcoxon test with Bonferroni correction for multiple comparisons) in neuroepithelial (NE) and ventricular radial glial cell (vRGCs) compared with the rest of the neural lineage (oRGCs, IPC, projection neurons, and interneurons). (C) 20 most correlated (red) and anticorrelated (blue) genes with DACH1 (ordered by false discovery rate). (D) Hub genes within genes with high correlation with DACH1. oRGC, outer radial glial cell; IPC, intermediate progenitor cell; Proj. N., projection neurons; Intern., interneurons; Oligo, oligodentrocytes; Astro, astrocytes; Micro, microglia; Endo, endothelial cells.

