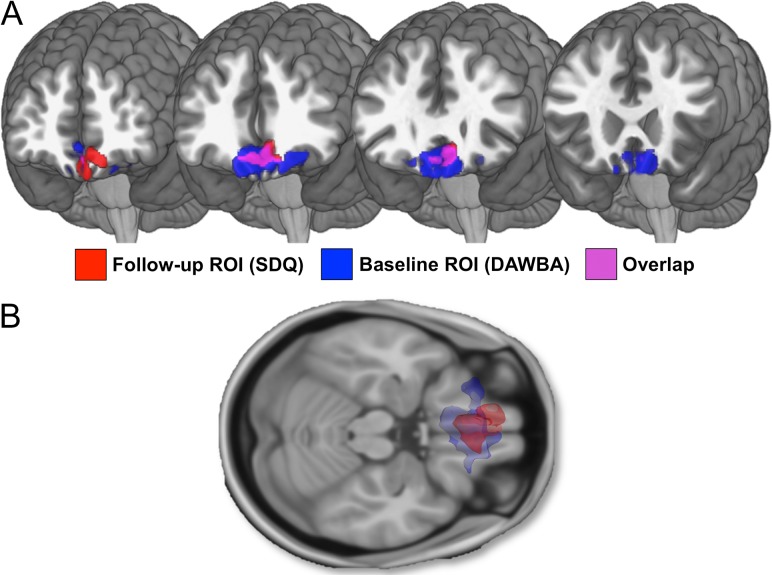
Figure 3.
(A) Blue depicts baseline regional GMV related to parent-reported hyperactive/inattentive symptomatology (assessed at baseline) (see Albaugh et al., 2017, for further details; N = 1538). Red depicts baseline regional GMV related to self-reported hyperactive/inattentive summary score (assessed approximately 5 years later at follow-up) on the Strengths and Difficulties Questionnaire (N = 1104). Pink represents overlap in results. Age, sex, handedness, total gray matter volume (GMV), site, pubertal development, performance IQ, verbal IQ, and socioeconomic status were controlled for in the analysis. An initial height threshold of P ≤ 0.001 was implemented at the voxel level, with a corrected family-wise error (FWE; P ≤ 0.05) subsequently applied to identify significant clusters. (B) 3D reconstruction of results. Blue depicts baseline regional GMV related to parent-reported ADHD symptomatology (assessed at baseline) (see Albaugh et al., in press, for further details; N = 1538). Red depicts baseline regional GMV related to self-reported ADHD symptoms (assessed approximately 5 years later at follow-up) on the Strengths and Difficulties Questionnaire (N = 1104). Results shown in axial view.

