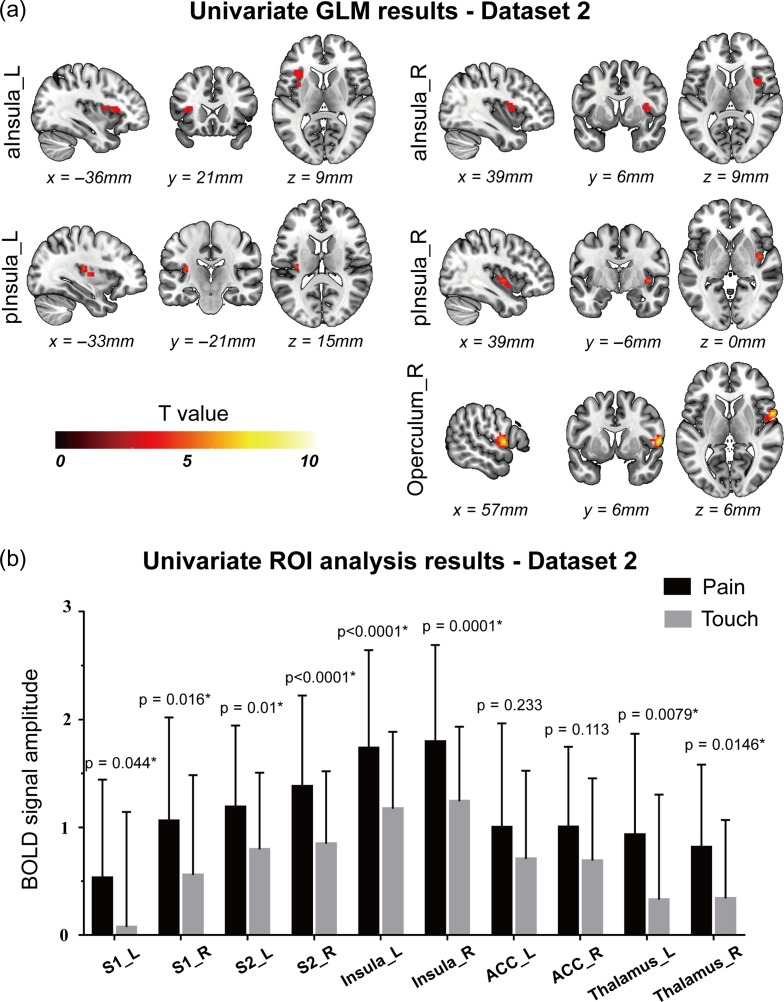
Figure 2.
Results of univariate GLM analysis (a) and ROI-wise analysis (b) obtained from Dataset 2. Panel a: five clusters in the bilateral insula (including both anterior and posterior part) and the right operculum (S2) were detected by GLM analysis to have stronger responses to painful stimuli than to tactile stimuli, and no voxel was detected to have higher responses to tactile stimuli than to painful stimuli. Panel b: BOLD signals and corresponding P-values of “pain vs. touch” comparison (paired t-test) for all explored brain regions. All regions except the bilateral ACC showed significantly higher responses to painful stimuli than to tactile stimuli. The BOLD signal amplitudes are shown as the average and standard deviation across participants. P-values < 0.05 are indicated by asterisks. L: left; R: right; aInsula: anterior insula; pInsula: posterior insula.

