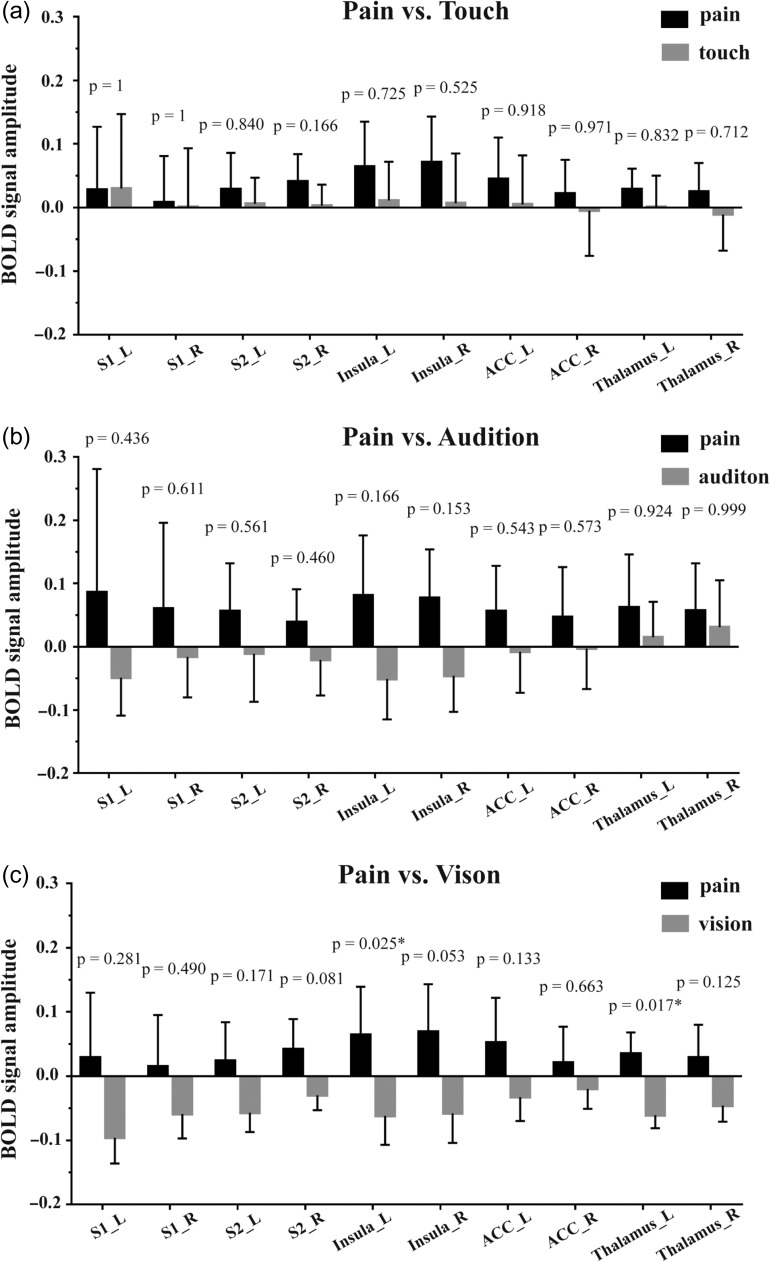
Figure 3.
BOLD signal amplitude in all explored brain regions, along with their corresponding P-values for the three comparisons between the modalities of the eliciting stimuli: pain vs. touch (a), pain vs. audition (b) and pain vs. vision (c). The BOLD signal amplitude are shown as the average and the standard deviation across participants. P-values < 0.05 are indicated by asterisks. L: left; R: right.

